Please hold the following thought you have expressed and please try to suspend the disbelief?
Your graphic of the measured screenshot is very informative and your description of the problems with amplifier ‘modelling’ vs ‘practical’ experience supports the expressed view. With your permission (and in future postings) I hope to use your real measurements of transient voltage response to compare with the LT Spice models from the templates I have indicated earlier.
During my work with LT Spice on modelling my system I found a super useful website. If you search for ‘nathaliebeimler’ with ‘audio amplifier output stage comparison’ there is (or was last year) an excellent technical resource for certain types of amplifier architectures and output stages with both LT Spice simulation models and measured results of actual built amplifiers.
Your comment about the behaviour of zero feedback circuits is valuable. The use of (global) or even local feedback in power amplifier circuits is a design choice and the questions of what happens when limits are approached (be that voltage or current limits) is a particular issue I have been indirectly exploring for about 9 months.
Thank you for your continued discussion - I do appreciate your views. I also want to start posting some of the transient response simulations to illustrate the effects of different cables in the LTSpice model of amplifier - cable - loudspeaker.
There is quite a lot of material that we could discuss. I do hope I don’t begin to create boredom for you or others with this posting of some information for background and some past results.
Yes, sort of! Actually had the measurement results in the acoustic domain recorded first. Although I had already downloaded and tried to use LTSpice at the beginning of September last year - I formed a ‘TLDR’ view and gave up after about 3 hours of watching training videos and creating a few simple circuits. (PS: I have a very different opinion now).
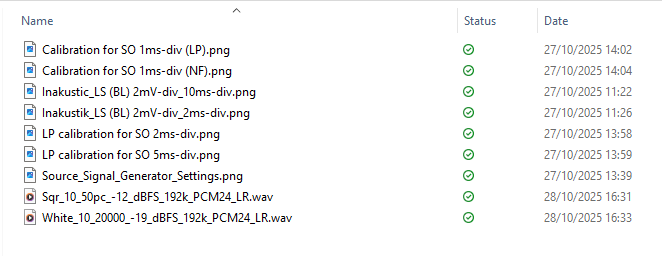
Here is a screenshot of the folder of a very small sample the acoustic ‘calibration’ and ‘reference’ files for (band limited) square wave testing from the end of October 2025.
An explanation of some of the two letter acronyms in the file names is as follows.
LP = Listening Position.
NF = Near Field
BL = Band Limiting (of test signals)
SO = (Linn) Space Optimisation On
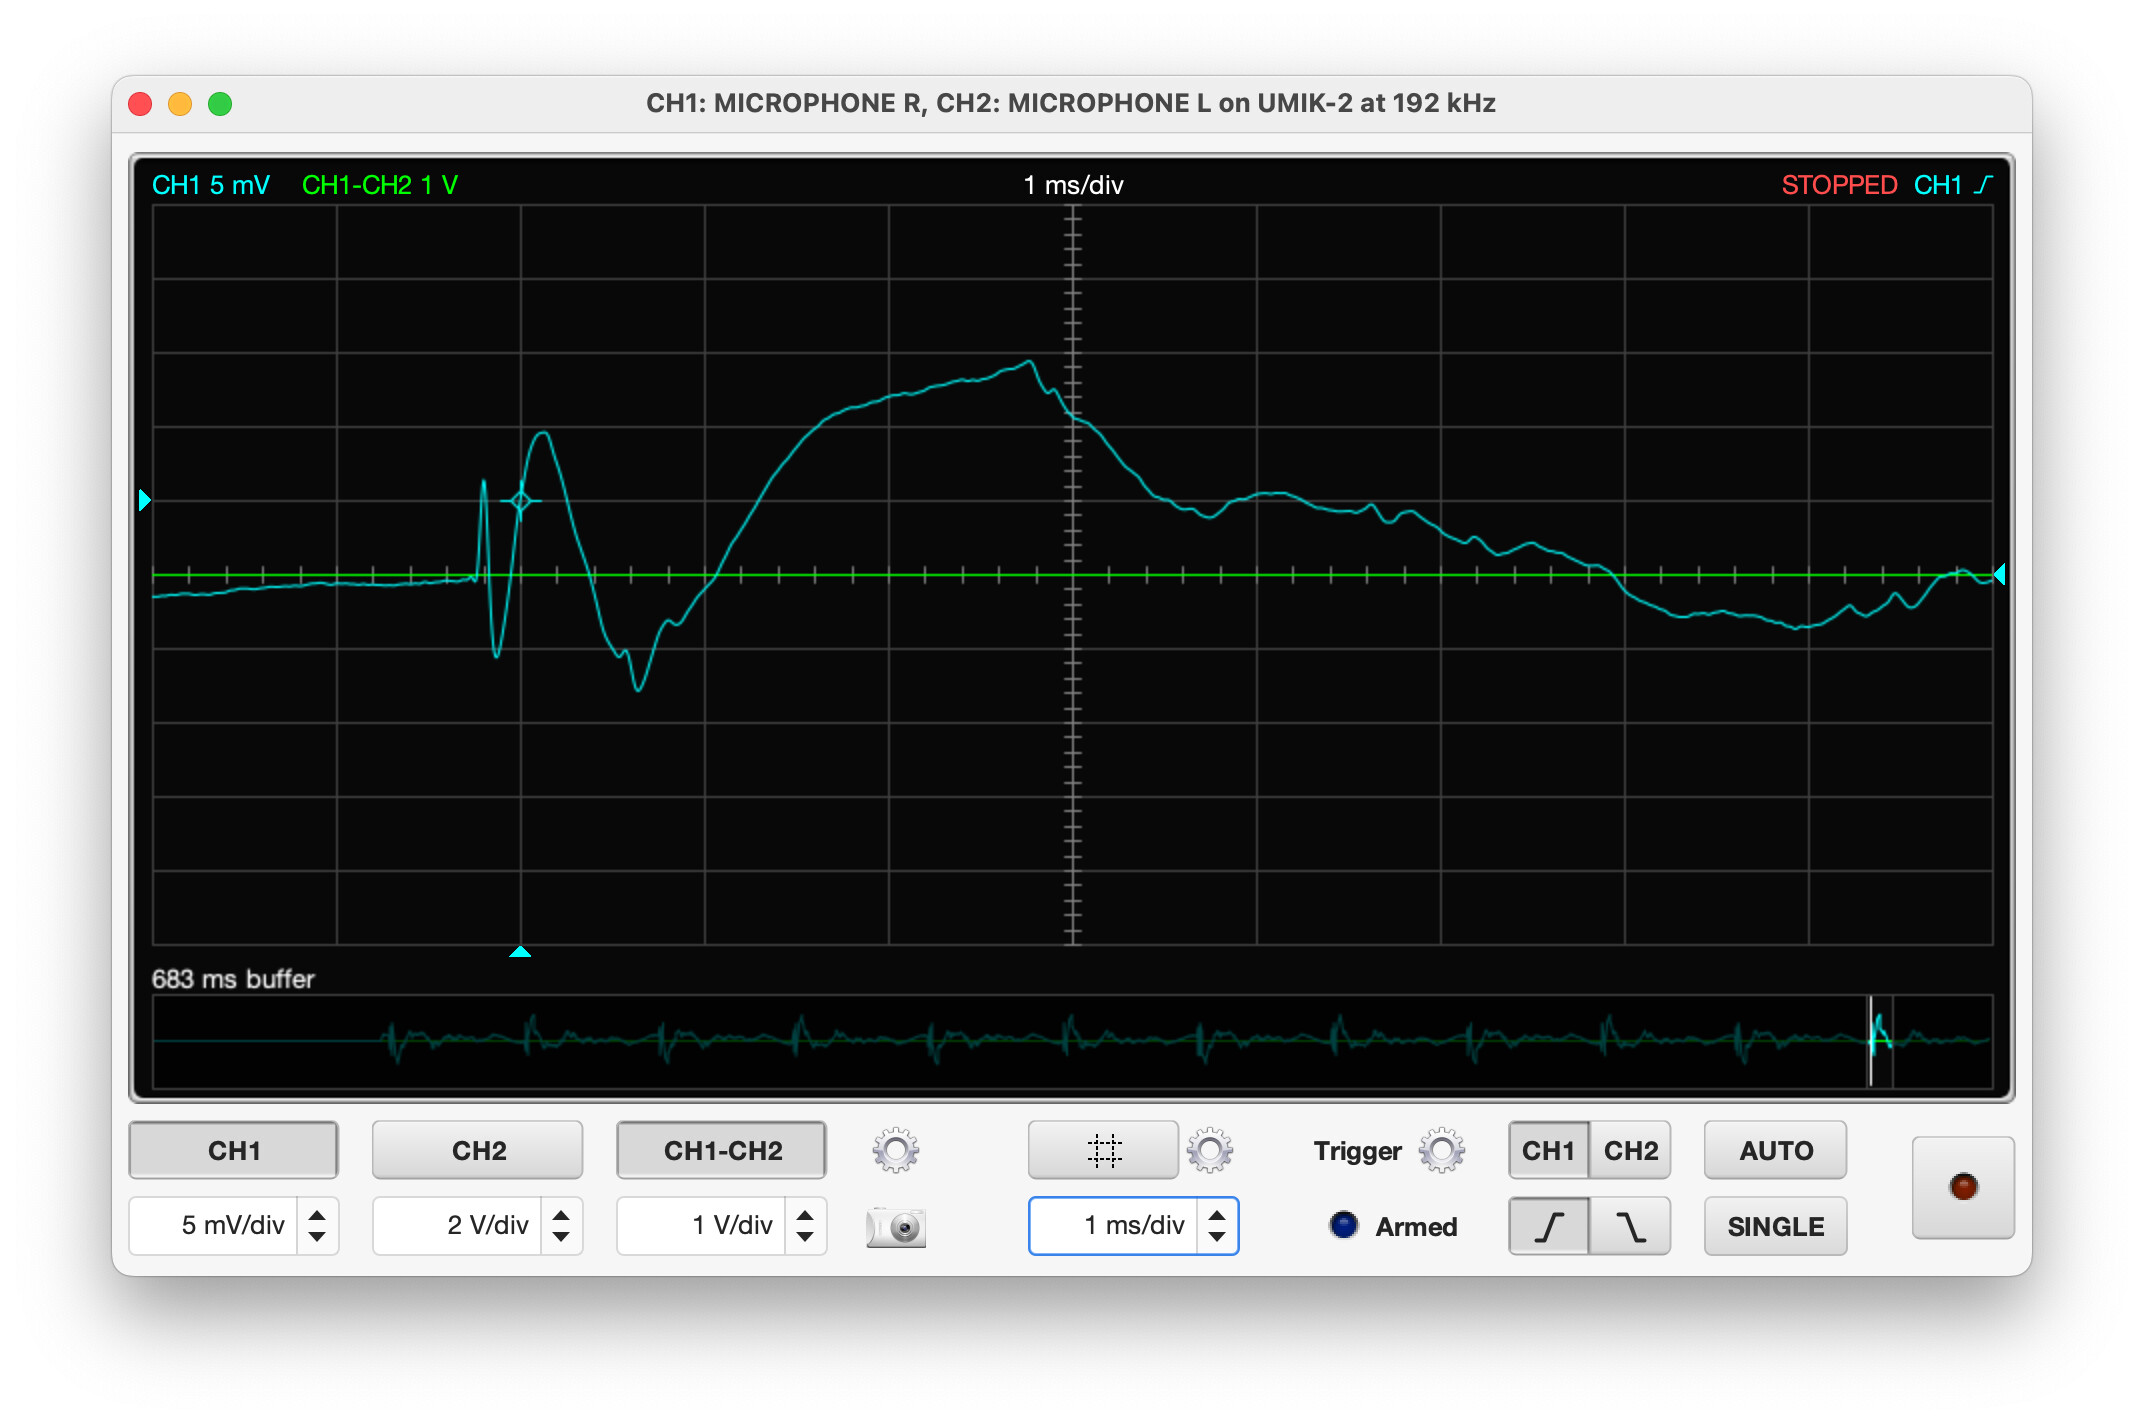
If you take a look at the above results and also compare to the Stereophile writers measurement of the Magico M2 (published in Vol. 43 No. 2 Jan 2020), hopefully one can see some clear similarities and perhaps also some subtle differences?
The work is in progress. For your information a key thing to get right is the parasitic losses modelled in the lumped elements of L and C.
@Innocent_Bystander has (possibly) asked the most important question ever on the Naim forum (at post number 404 on this thread) (see link here).
My (engineering ) judgement is that the skin effect losses are greater in the example of Naim NAC A5 loudspeaker cable when compared with the DIY Copper Pipe ‘cable’.
The following screenshot shows how one enters such data in LT Spice.
The two data fields of Parallel Resistance and Parallel Capacitance are shown blank in this image. It is these data that need to be manipulated to have appropriate (non-zero) values to get the simulation to match the L, C, R values measured ay multiple frequencies on the real life version of NAC A5.
Furthermore - in this simulation model - perhaps you can observe that I have begun to parameterise a variation in lumped element Inductance and Capacitance per metre, based on the position of the ‘lumped element’ along the cable length in the model. In this case I am in progress of trying a simple sinusoidal variation in geometric spacing of +/- 1mm on the nominal 10mm declared value for NAC A5, exploring the impact on inductance (L).
PS: Perhaps someone can comment please before I run over the ‘multiple posting’ limit?
However I feel I am slightly compromised in only having four frequency (decade ratio separated) points of data. It may be enough to get the LTSpice model sufficiently accurate, but it may not.
You may recall the origins of my quest to select the technically correct loudspeaker cable for my system began in September 2025? An appropriate link to reinvestigate what was posted on my ‘Audio Grade Solder’ thread appropriate to these discussions is here.
In other words, as well as my own measurements of electrical parameters of loudspeaker cables, Alpha Audio had published results of their own experiments and one particular cable (Chord Epix-X) is one that I also own. So I have the opportunity to cross reference my measurement data with the Alpha Audio data.
At that time (September 2025) I was only aware of the work undertaken by Alpha Audio on Interconnect and Loudspeaker cables undertaken in 2024. Three weeks ago I found that Alpha Audio had already published prior work on testing 15 Loudspeaker Cables in 2022. (PS: Good search term to easily locate that work is ‘Alpha Audio: Megatest speaker cables – real measurements, samples and blind test!’)
This discovery has turbocharged my work as the square wave testing was undertaken just on the cables with a 50ohm source function (pulse) generator (RIGOL) and without extra amplification or load. Although there was much criticism by commenters on that work, for me it provides greater clarity as to what a given cable does well beyond the audio bandwidth! I can simulate such a test quite easily in LTSpice which gives yet another (potential) validation of my LTSpice modelling.
Furthermore, some of the brands and types represented in that work are of specific interest.
PS: Typically my focus is on the Transient Response chart which is usually that last thing in the set of charts presented for each cable by Alpha Audio.
A number of things have happened very recently which means some opportunities have come up that are simply too good to miss! Please permit me to divert to some humorous presentation of measurement and evaluation data and return to the core ‘football’ theme…
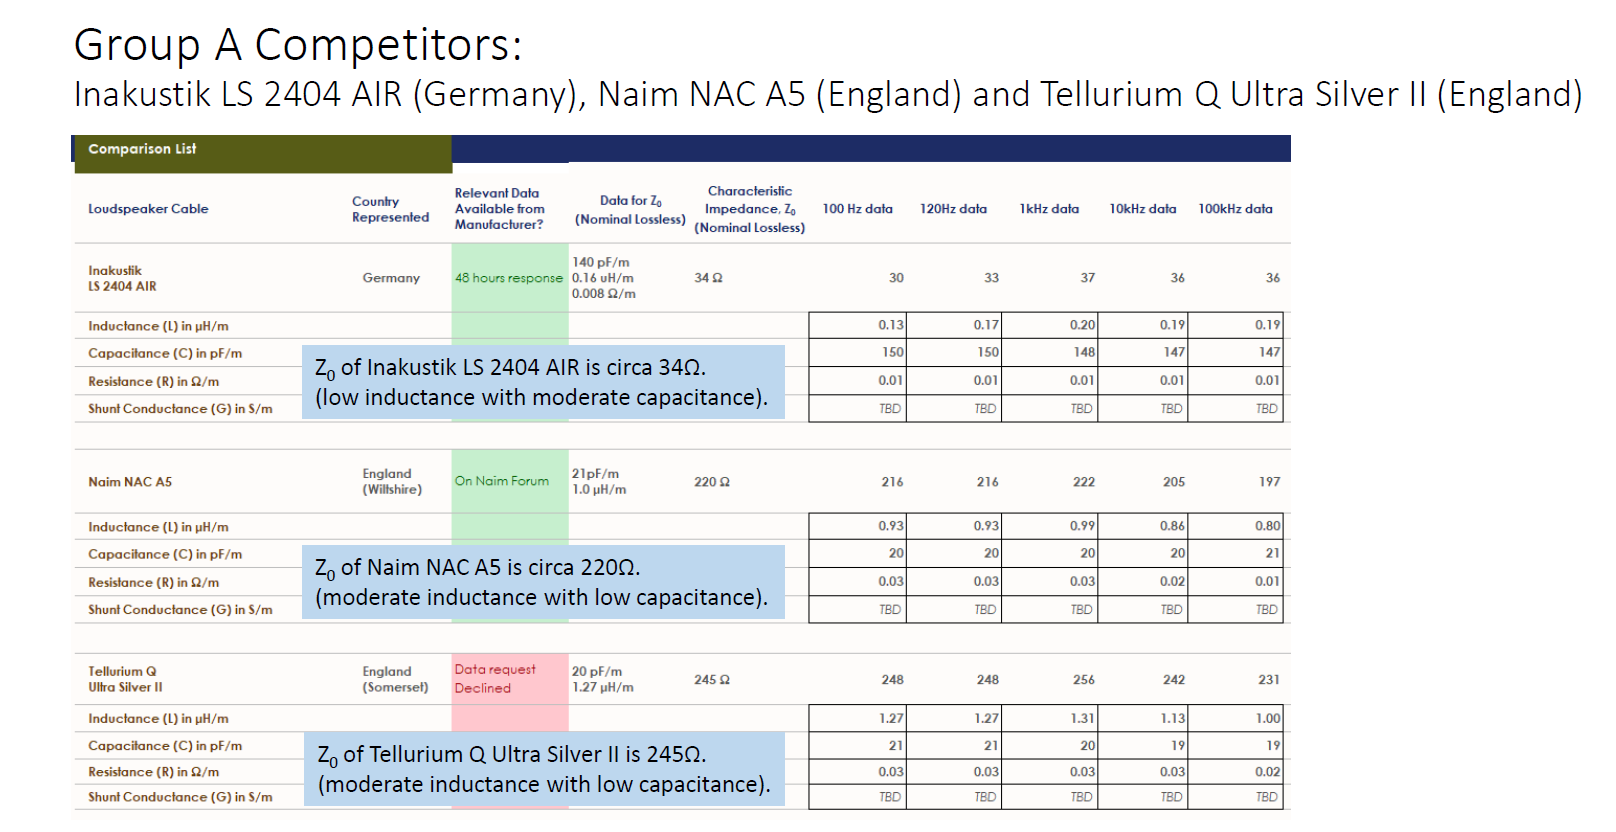
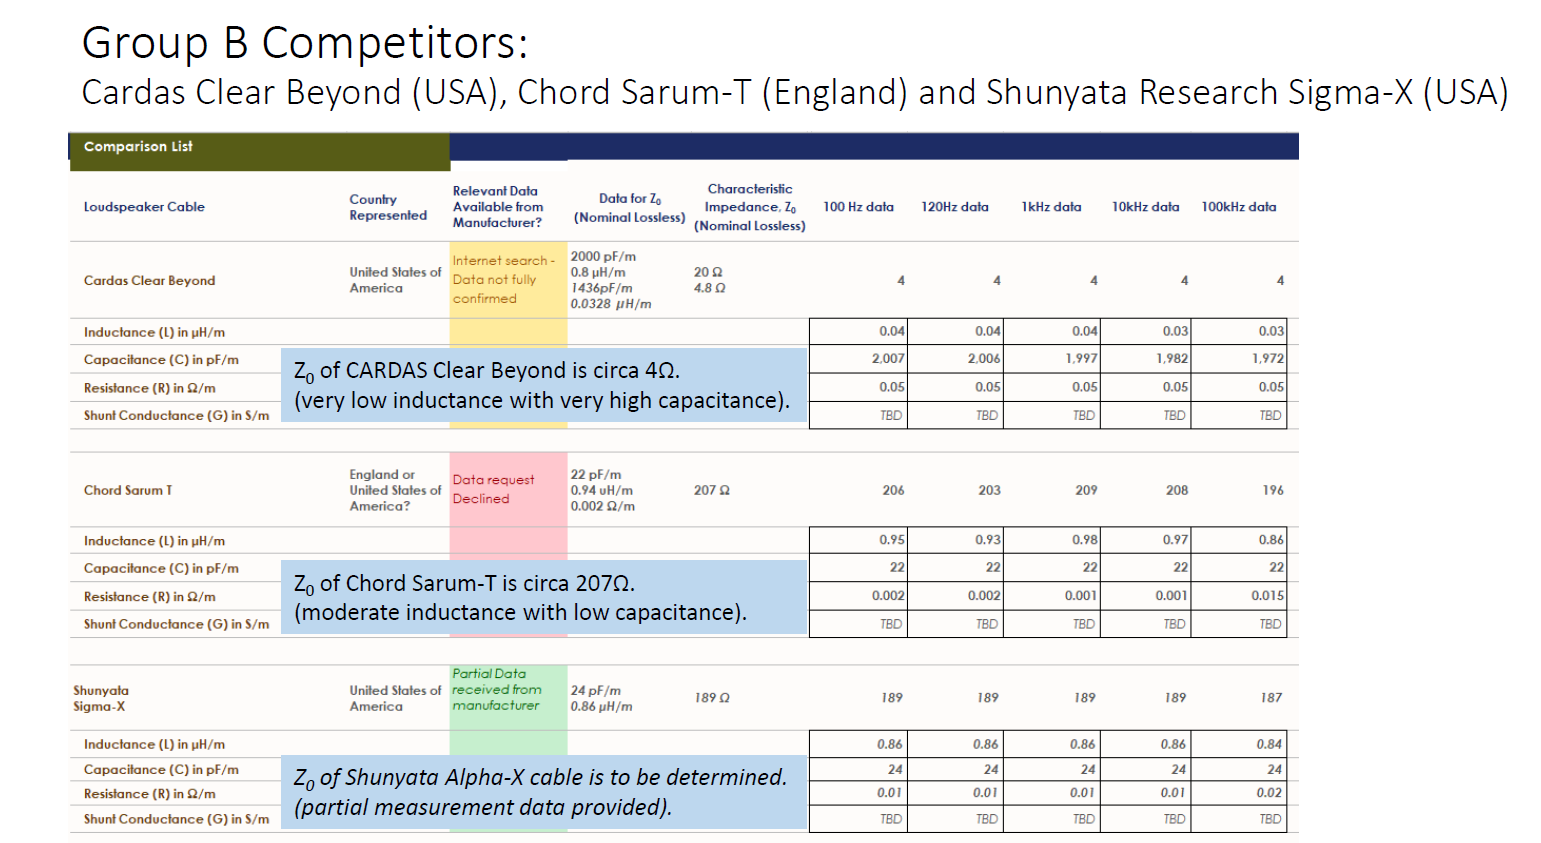
In the World Cup of Loudspeaker Cable selection in my home the tournament is shaped by trying to select brands that have been forthcoming or honest with data or responses (to technical enquiry) about their products. Following the pre-tournament selection process (documented earlier in this thread and also the ‘Audio Grade Solder’ thread) I have been left with a total of six brands worthy of evaluation.
Because of the effort involved in creating appropriate listening test evaluations and because I have not fully completed the LT Spice model developments I decided to use two Group competitions of three Loudspeaker Cable brand/types. I.e. a ‘Group A’ and ‘Group B’ of three cables in each and then the winning cable from each Group go forward to the Final.
Given that this is a HiFi forum, I am not certain you are eager to know which Countries (brands) are represented? Nor the performance data that the teams (cables) have historically delivered?
Any thoughts?
Edit PS: England is sufficiently represented - with Naim NAC A5 in Group A.
Given that this thread started in Jan ‘25, I think it’s fair to say that anyone still following has a deep interest in the countries (brands) involved, and their relevant history.
Hi All and thank you @IainW for the encouragement ,
Technical Disclaimer: Whilst all data presented in the following tables were obtained during the last nine months with a calibrated LCR meter, please note that the entries should not be taken as official measurement data or representative of any official specifications of the cables.
For that data or information - please contact the manufacturer (or in country distributor) directly.
FIFA Comment: Shunyata Research were requested to provide the Alpha-X team. We understand that what is being supplied for the Group B competition is the Sigma-X team.
I just checked and this loudspeaker cable selection project has been going for over a year now!
I am practically exhausted, however I think I can see the light at the end of the tunnel. It is your (and others) continued engagement and interest that has kept me going through the months.
By way of reminder here are the Key Elements of Test Procedure:
a). Tests conducted using six participants (2 females, 4 males).
b). Each participant had a dedicated and independent (of other participants) listening session.
c). Each participant selected their own short piece of familiar music (~5 minutes long).
d). Selected genres include blues, folk, classic orchestral, opera, prog rock, alt rock/piano ballad.
e). Participants were not informed of the (three) different ‘things’ under evaluation.
f). Each session had a 15 minute ‘settling in’ period where an electronic setting was varied once between two plays of their selected test track so that the participant could get used to the test environment and confirm comfort with the volume setting.
g). The subsequent active evaluation period (~25 mins total) exposed the listener to their selected short piece of music played three times sequentially (once for each cable).
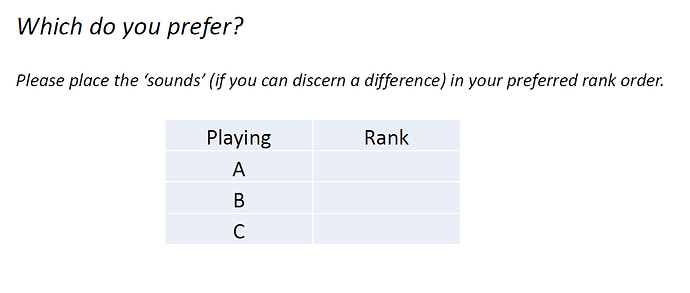
h). The listener ranked the ‘sounds’ in order of preference.
Note: The order in which the listeners were presented with the different cables (of which they were not aware) was ‘randomised’ amongst the six participant sessions with the intention of eliminating any potential bias introduced through the order of listening.
I appreciate that feedback on the procedure was provided by forum members last year.
However this time the gap between each play of the track required the listener to leave the media room and sit alone without distraction for about two minutes so I could change the cables.
With this additional complexity, perhaps you (or any other readers) can comment on any specific weaknesses in the test method prior to me publishing the results of the Group A competition?
Was the sound level checked and verified to be the same for each play (or volume control settings noted to ensure?
If I read correctly each victim had just a single play through each of the 3 cables? At the cost of significant extra time, would it not be better to repeat at least once, maybe on a different day, same music, same cables, but different order labelled D,E and F? (Or course ideal would be 6 times to cover every order permutation, but then the term victim might be truly appropriate, and cause unwillingness to participate).
Did you ask people to note if they felt any differences are subtle or very noticeable to them, and, if whether they couple describe in a few words what seemed better about their favourite?
Oooh, that’s a nice word! It should be formally adopted!
I understand what EoE means - or rather what I would mean - which is that even just test measurements can give a good idea of at least some aspects of how something will sound - e.g curtailed bass, curtailed treble or other significant humps or dips in response - and might tell someone that they are unlikely to enjoy with their choice of music, though of course unless one has heard something very similar the actual sound might not be exactly the same as expectation.
Yes, the specifications of the equipment could suggest some basic aspects of the sound profile, but they will not be able to tell anyone what music sounds like with that system in their room with their way of listening to music.
If someone had the chance to either read the spec sheets or listen to the system before agreeing to buy it, they would be nuts to do the former.
I hope I’ve put my argument into the back of the net on that point.
With speakers in particular I would start by looking at specs and test data, and reviews - preferably comparative reviews - and from that I would make my shortlist. I would then very much need to hear before buying, because experience has told me that speakers can sound so different even when on paper there is nothing obvious to choose between them. I feel for the people who for whatever reason are not able to hear speakers before buying. Trying to choose purely by auditioning would be much more time-consuming, and/or rely too much on the stocking policy and/or preferences of whatever dealers I might think of visiting. I am less bothered about hearing amps, but with DACs I probably wouldn’t look at specs, rather just reviews for shortlisting then audition. But I don’t think there’s an argument here!
Thanks for checking and commenting on the test process.
Sound level was the same for each session (A, B, C) of play but not the same for each participant. Each participant chose their own music which are likely to be recorded with different dynamics and some listeners prefer loud and some not. It is possible that the TQ cable may affected by the ‘volume’ aspect but I think for each participant the volume was broadly comparable (+/- 1dB) to the levels I use for my own listening (for a given music genre).
Re your point 2, I do agree it would be better! However as you note I think the term participant would definitely become ‘victim’ and there is both a Group A and Group B competition before we get to the Final!
Re your point 3, yes I did (and it has been recorded) but I did not ask them to formally think about that ahead of the test, the evaluation was simply the question posed on the sheet of paper.
Other details:
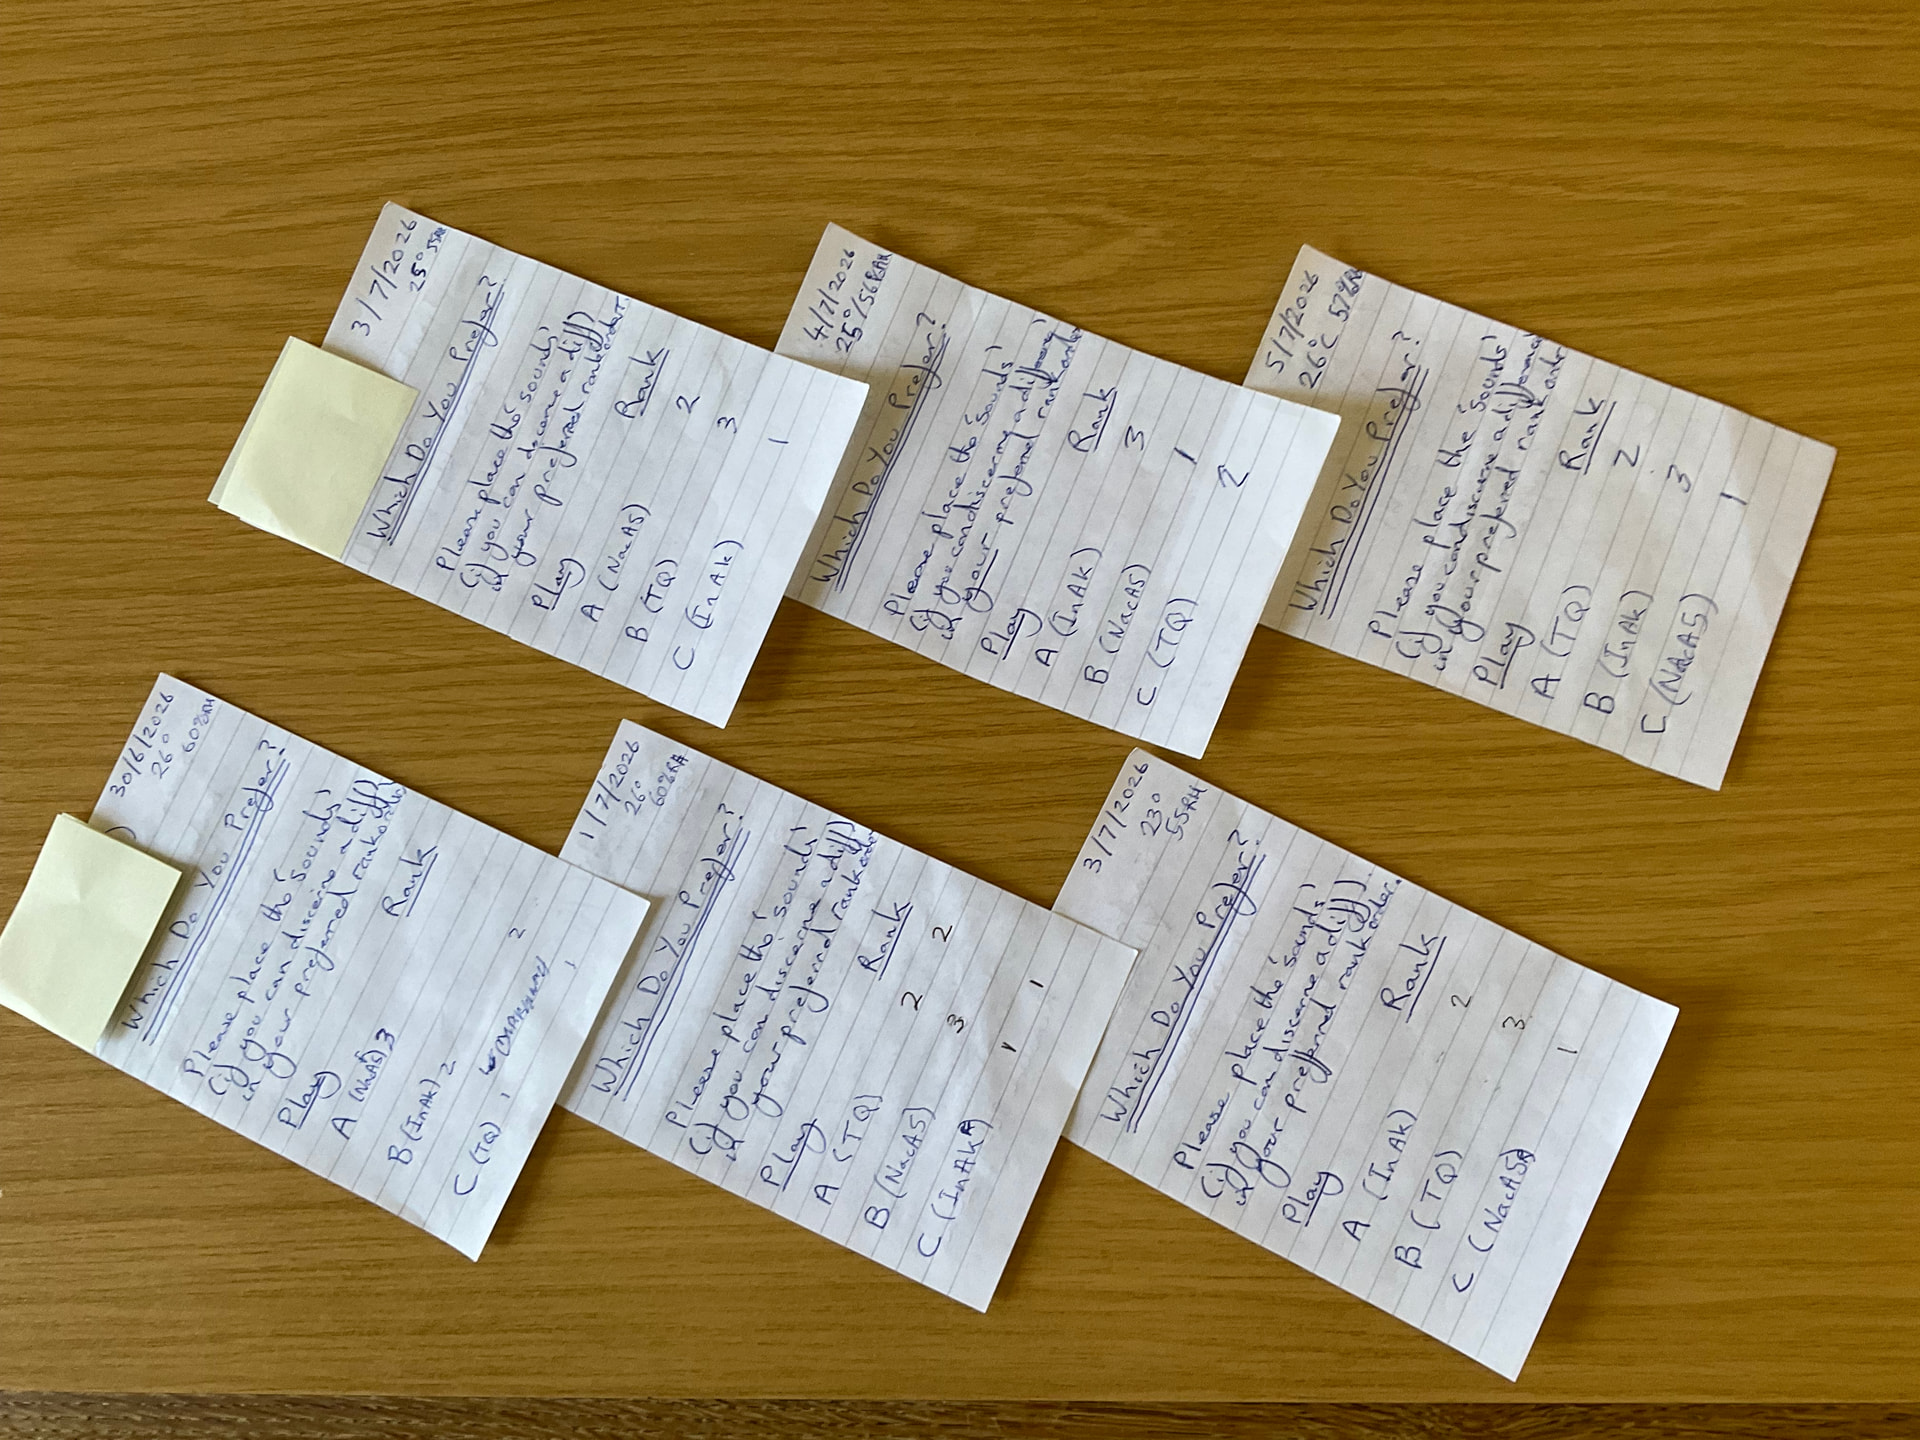
I noted the temperature and relative humidity of the room on conclusion of play session C and the experiment assumes that these values apply throughout the 25mins from A, though B to C. These data are annotations on the score sheets shown in image below.
Other added marks (subsequent to the score sheet being completed by the participant) are the record of which cable was in place for which ‘play’. People will just have to trust that I have added these marks diligently and honestly.
In any case, I needed to add these notes to make sure I kept to the specific randomisation sequencing of cable ‘play’ order for the following participant.
The Sub Bass was OFF. Linn Space Optimisation ON or OFF was the electronic change used in the ‘settling in’ period, with the order of play of ON-OFF or OFF-ON randomised across the participant test days. Most (5) participants preferred SO ON. However there was an additional subtlety. The SO ON setting used initially in the settling in period was calibrated for 23degree C and 55% relative humidity - that was done so that SO did not have an ‘unfair advantage’ over the NO SO setting. For the actual cable evaluations I used a consistent SO calibration at 26 degree C and 60% relative humidity as this was a setting that was closest to the reality of the test days.
PS Edit: The participant listeners were permitted to take notes to aid any judgements they might form during each ‘play’. The eagle eyed amongst you might note some peculiarities in the first two participants score sheets - more on that later.
Not quite sure of your question?
The participants score sheets each have the date of the evaluation recorded in the top right of each bit of paper (UK date presentation - not US date presentation). The first participant sheet is bottom left in the image and then next participant sheets is to the right in the image etc.
When handed to the participants, the sheets were blank in the lower half below where ‘Play’ and ‘Rank’ are written, with the exception of letters A, B, C written down the left hand side in the ‘Play’ column.
The participant was asked to place their ranking preference, i.e.
‘1’ indicates ‘most preferred sound’,
‘2’ indicates ‘next best preferred sound’,
‘3’ indicates ‘least preferred sound’.
I hope the above clarification helps read the score sheets?
Sorry, ignore that - I had forgotten it was 6 participants doing once each - for some reason I had conflated reality with my own thoughts of repeatiability, taking as 3 participants each doing twice!
But I do strongly feel that repeatability is an important measure, the consistency or otherwise of results being highly meaningful.

 ) judgement is that the skin effect losses are greater in the example of Naim NAC A5 loudspeaker cable when compared with the DIY Copper Pipe ‘cable’.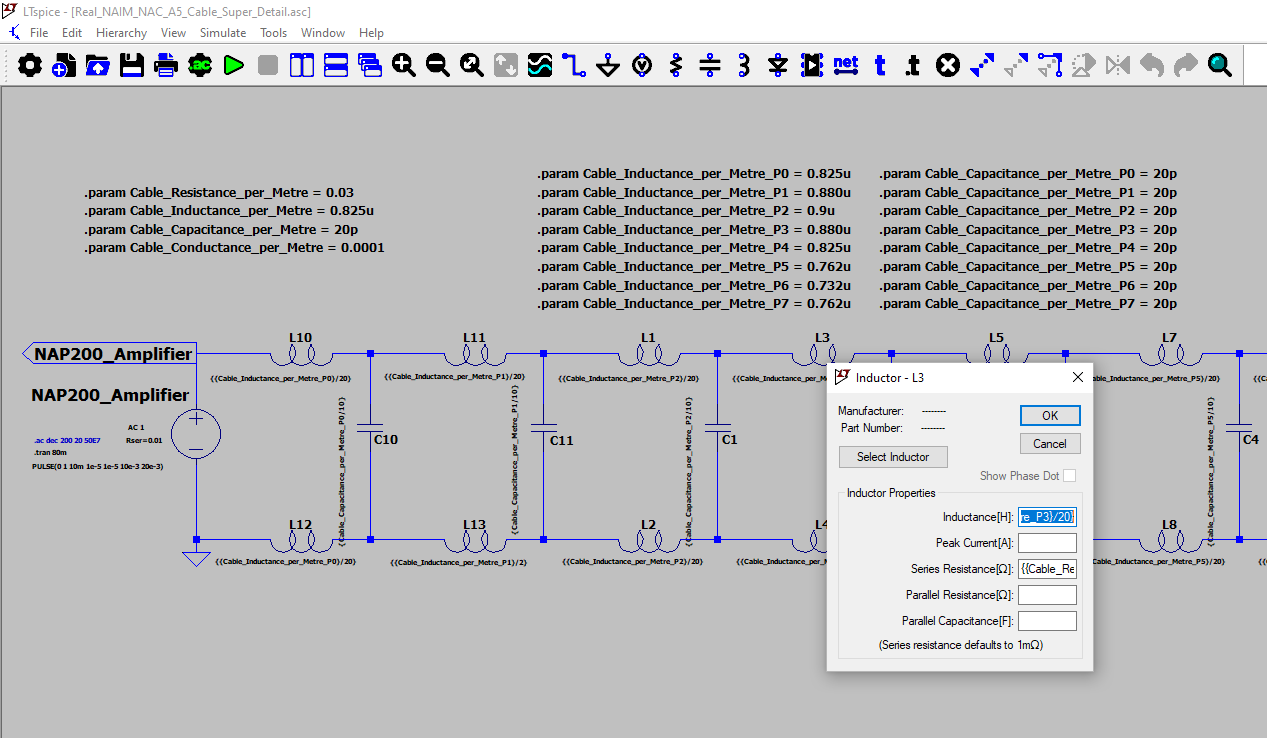

 ,
,