English Premier or International (HiFi) - Tournament Preparations Begin

This is the Fifth Posting and describes why certain measurements are needed:

For Results Assessment and Presenation both Frequency domain and Time domain analysis is needed.

For Frequency domain analysis:
Results are presented as relative signal magnitude (dB) vs frequency (Hz) on logarithmic scales (see next posting no 6).
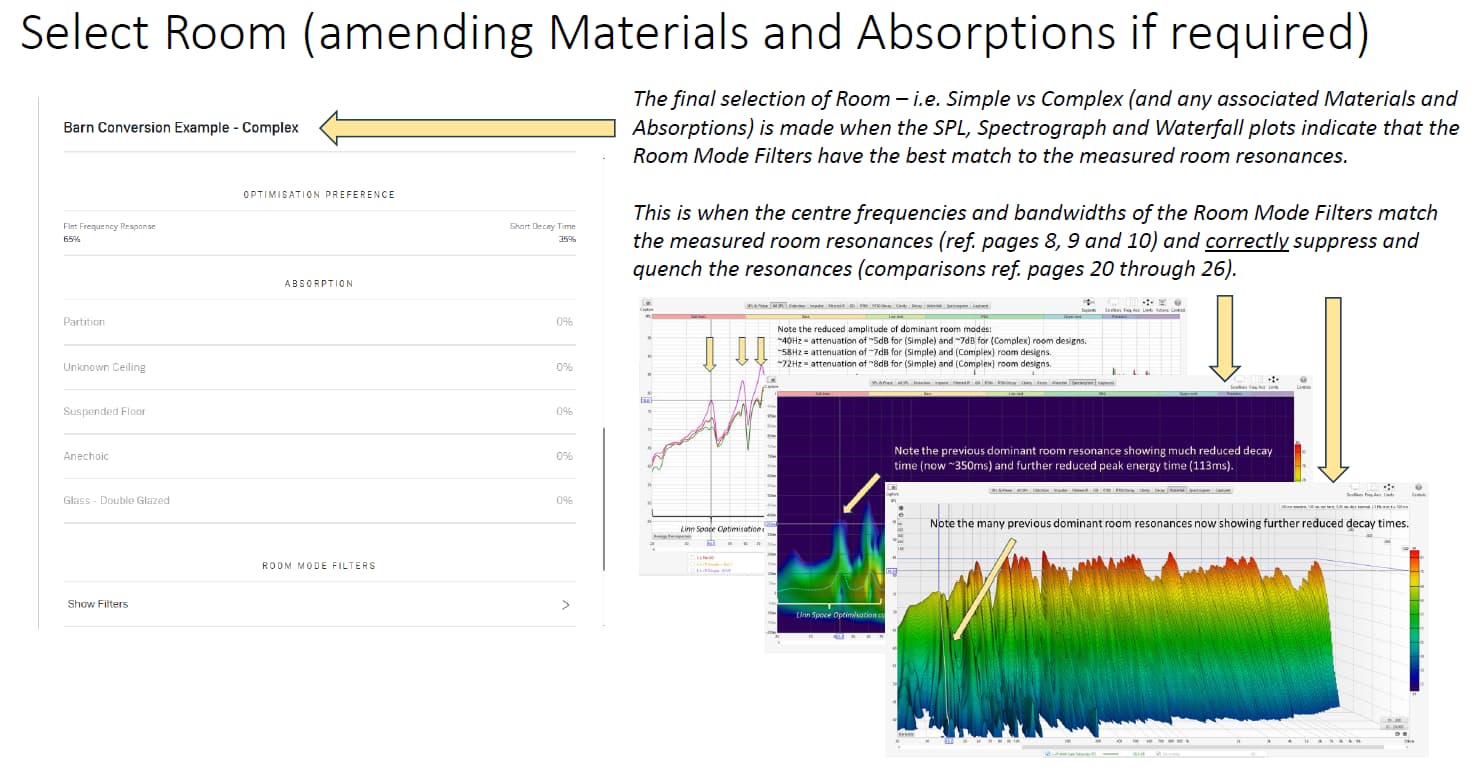
Why? - These results will be used to identify accurately the resonant frequencies in the room and confirm Room Design validity.

For Time domain analysis:
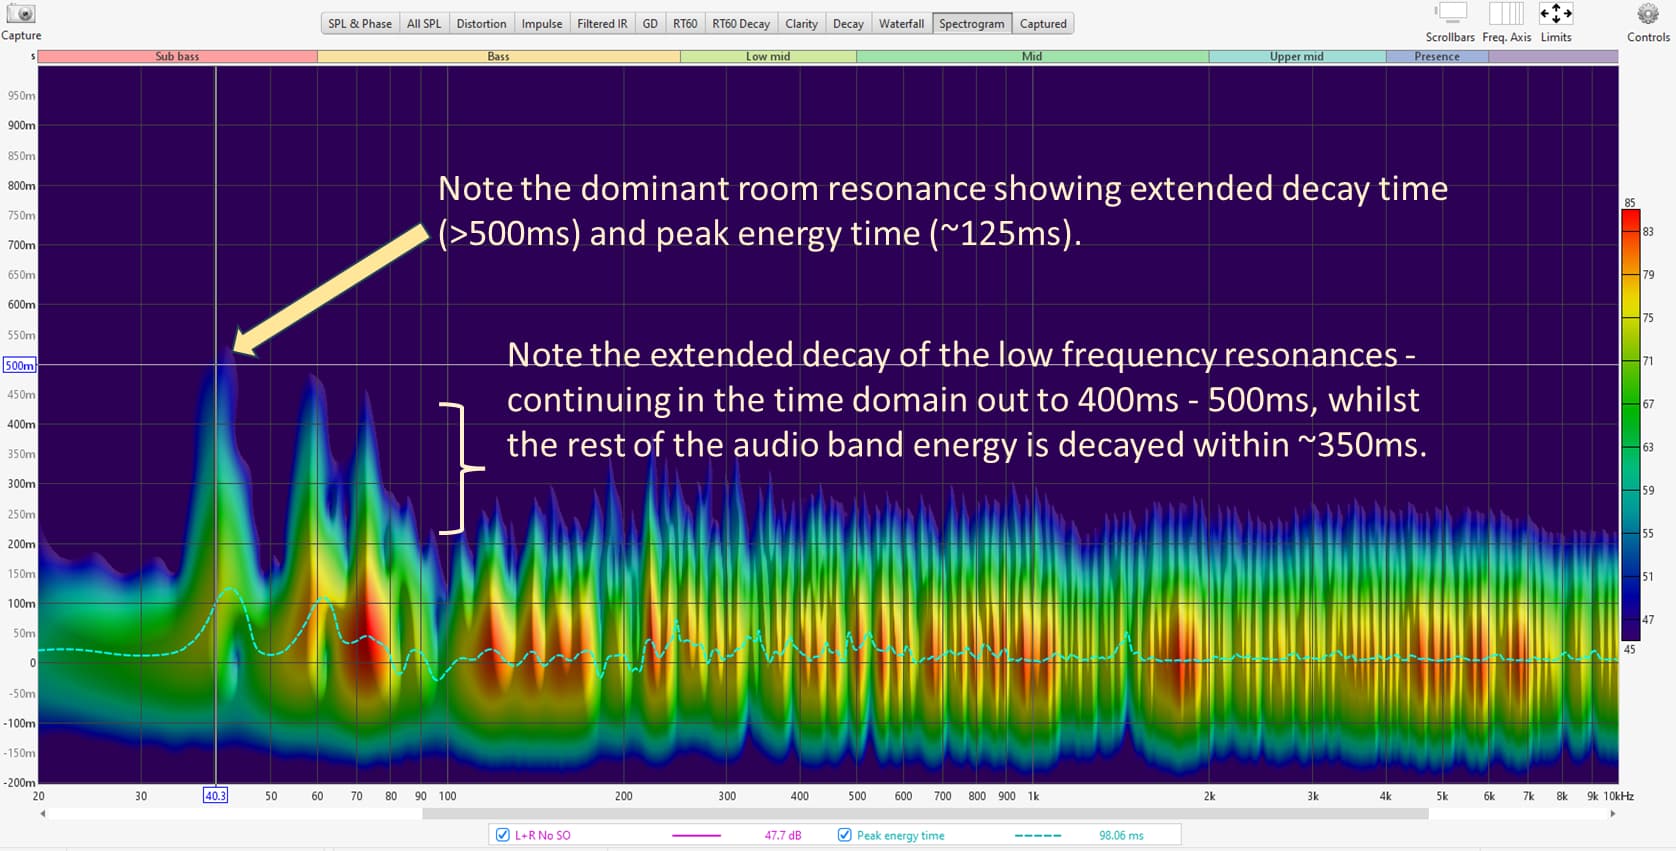
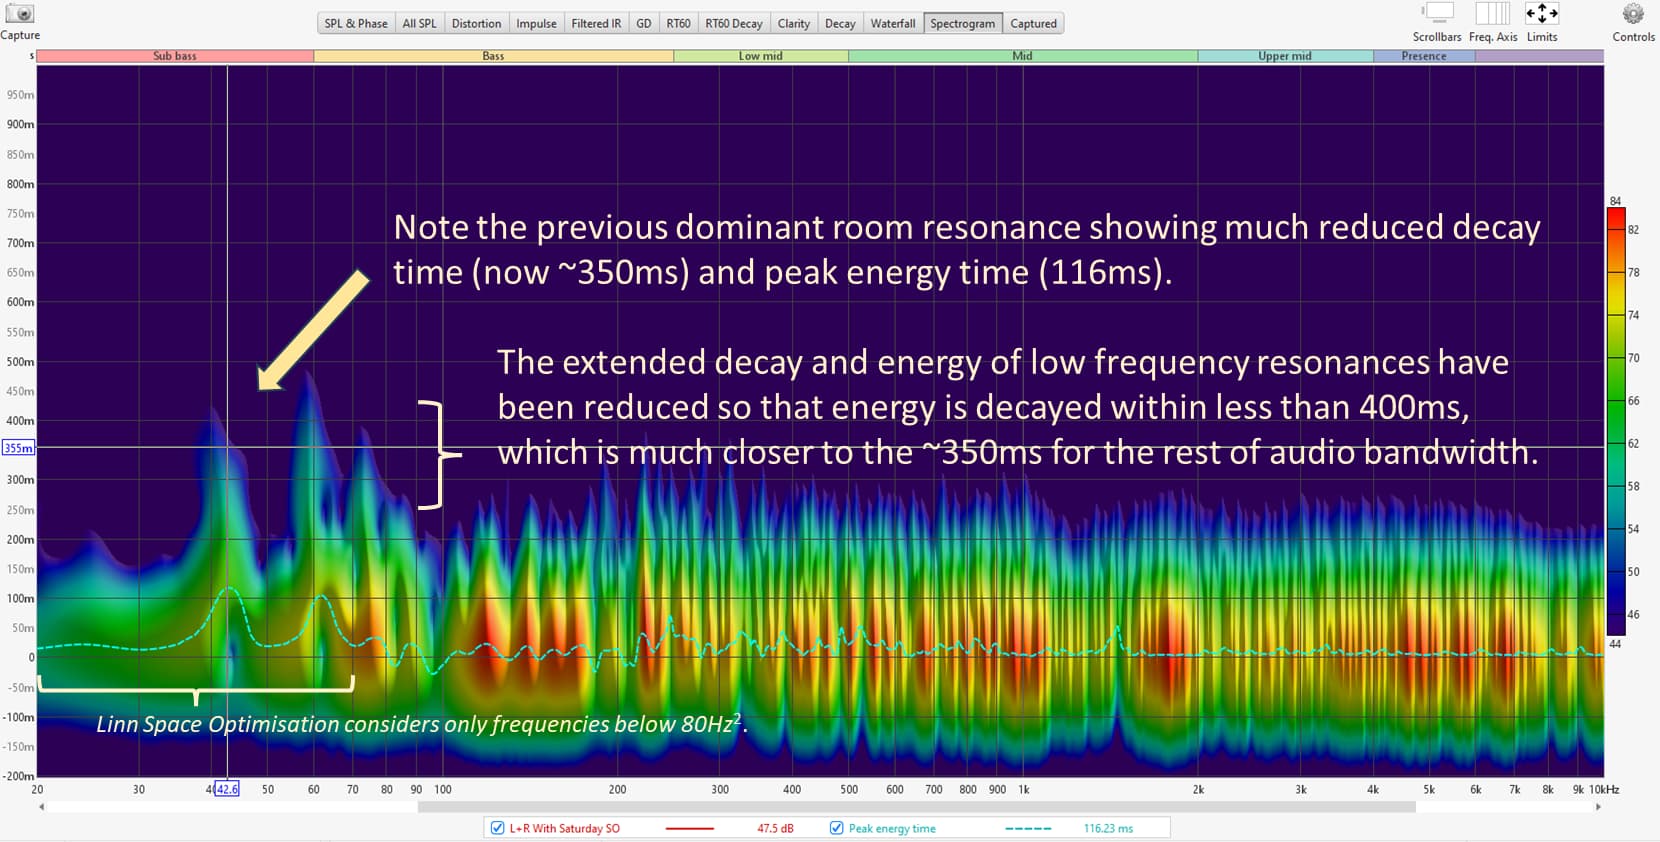
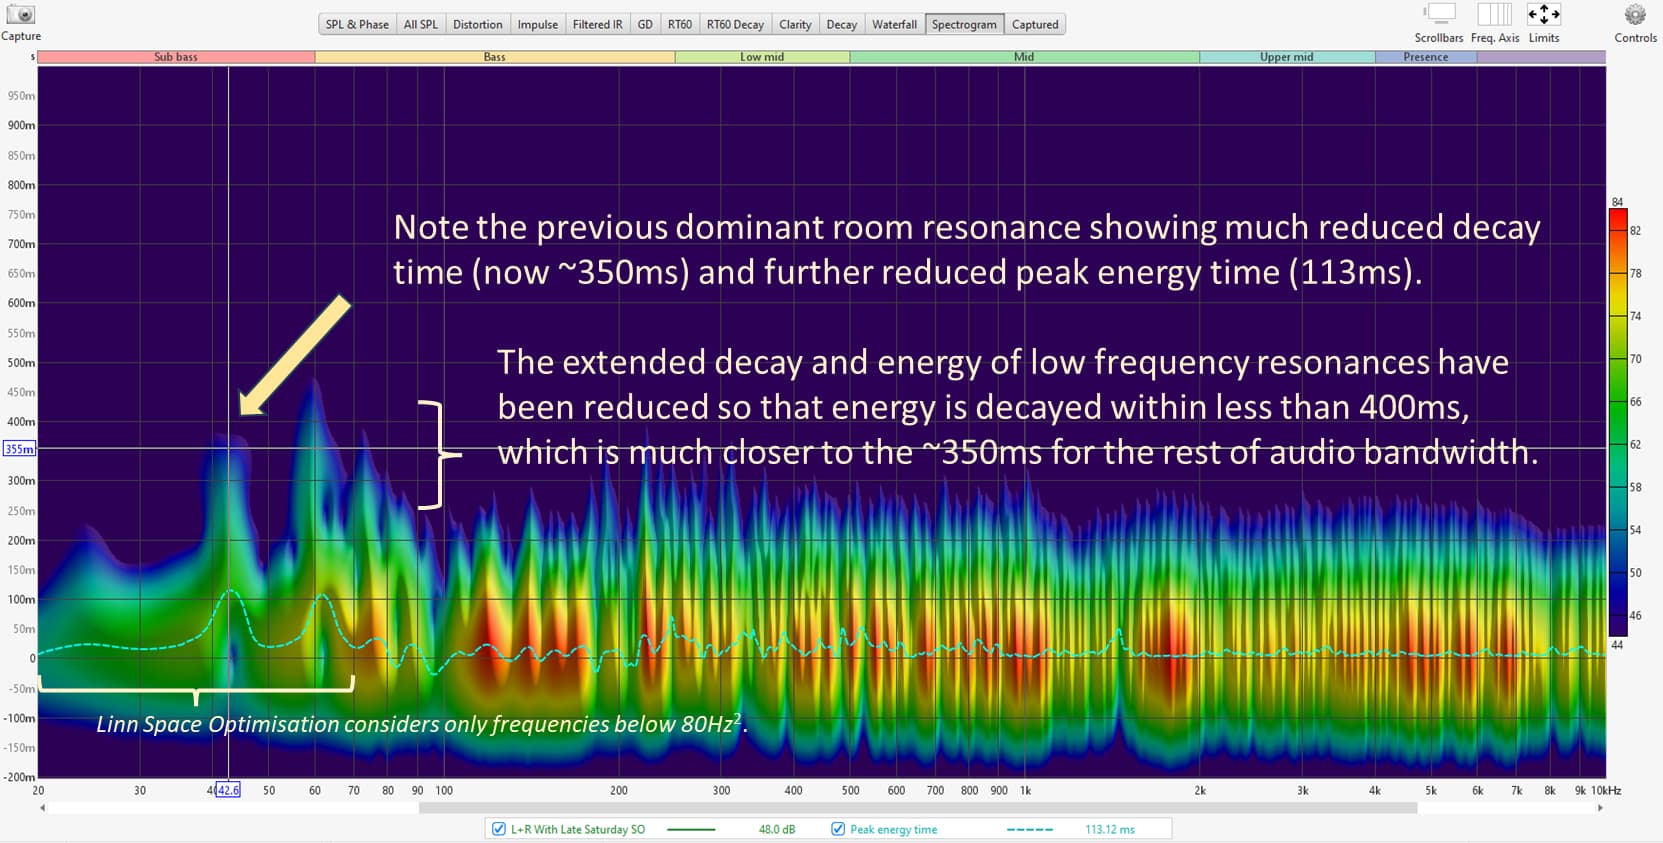
Results are presented as time decay (ms) vs frequency (Hz) (including amplitude indicated by a colour/heat map) on a logarithmic scale (see next posting no. 7).
Why? - These results are used to identify the problematic room resonance decay times and confirm Room Design accuracy.

For combined Frequency and Time domain analysis:
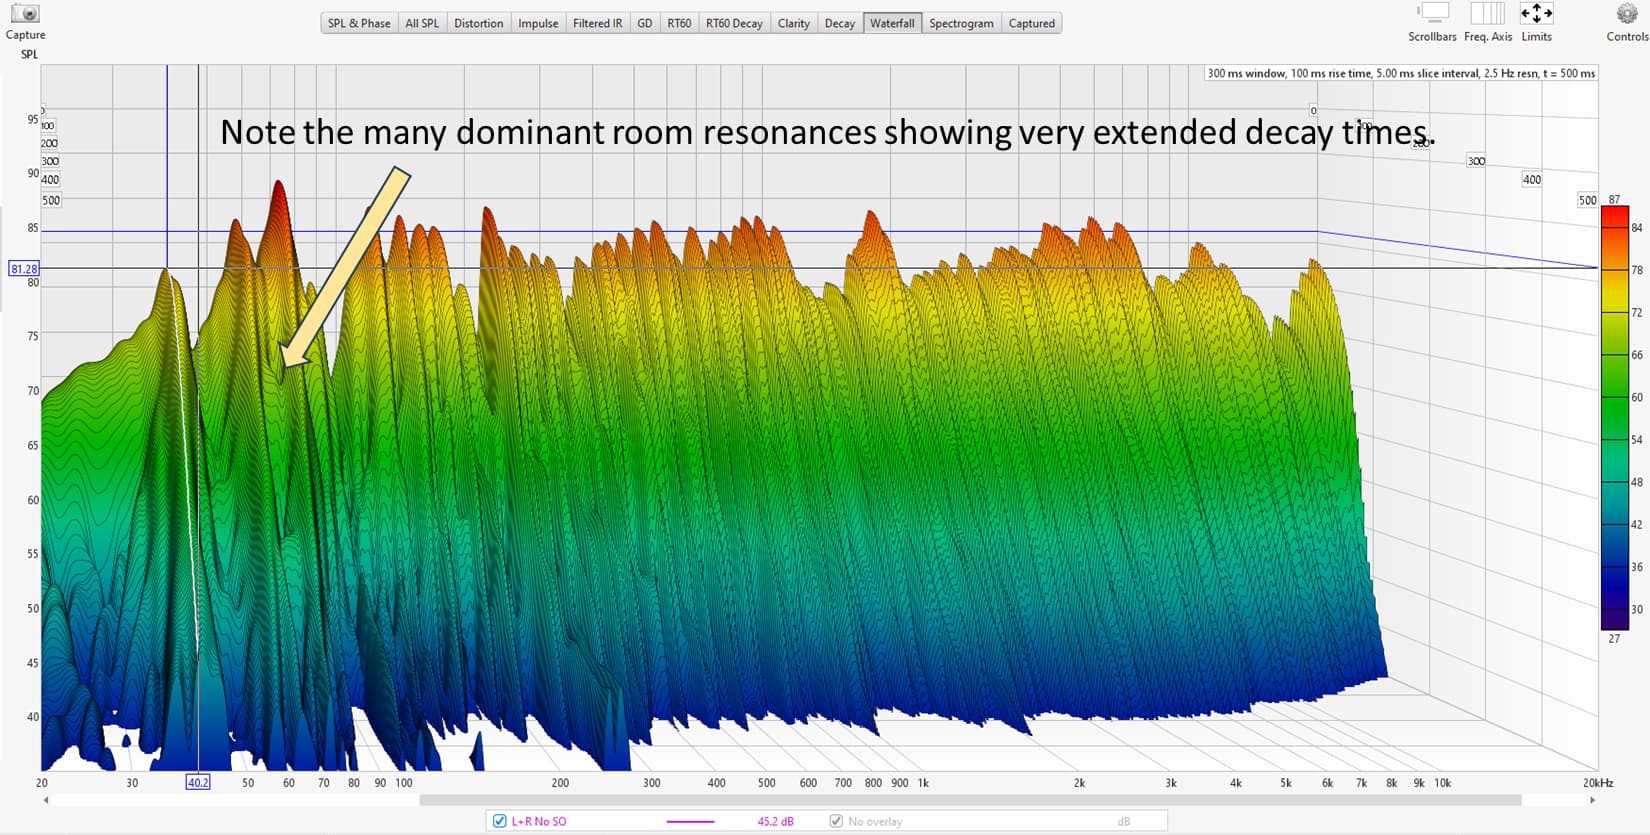
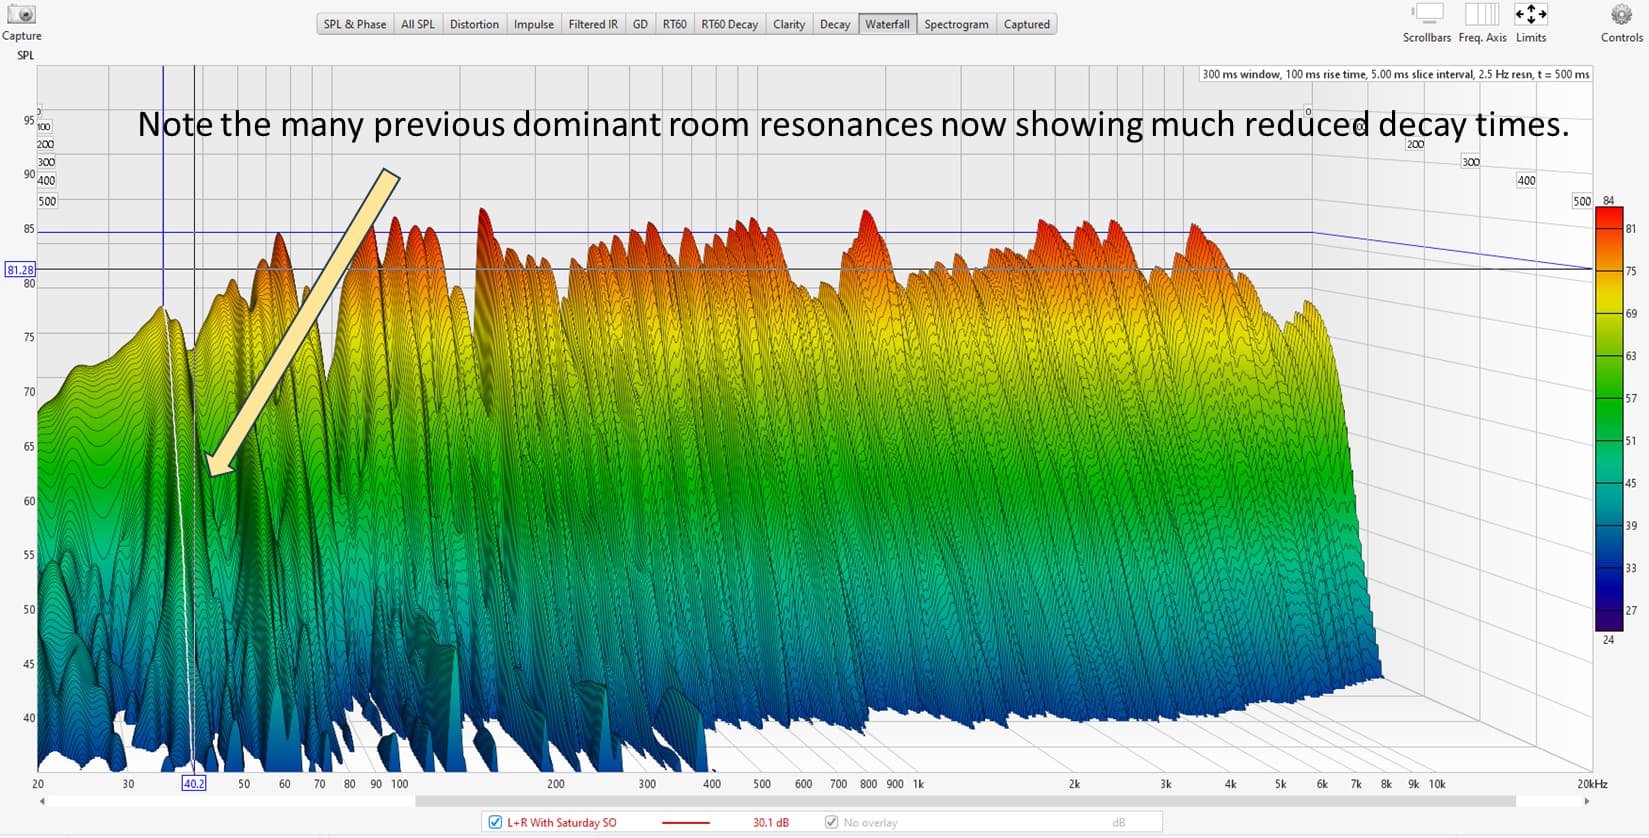
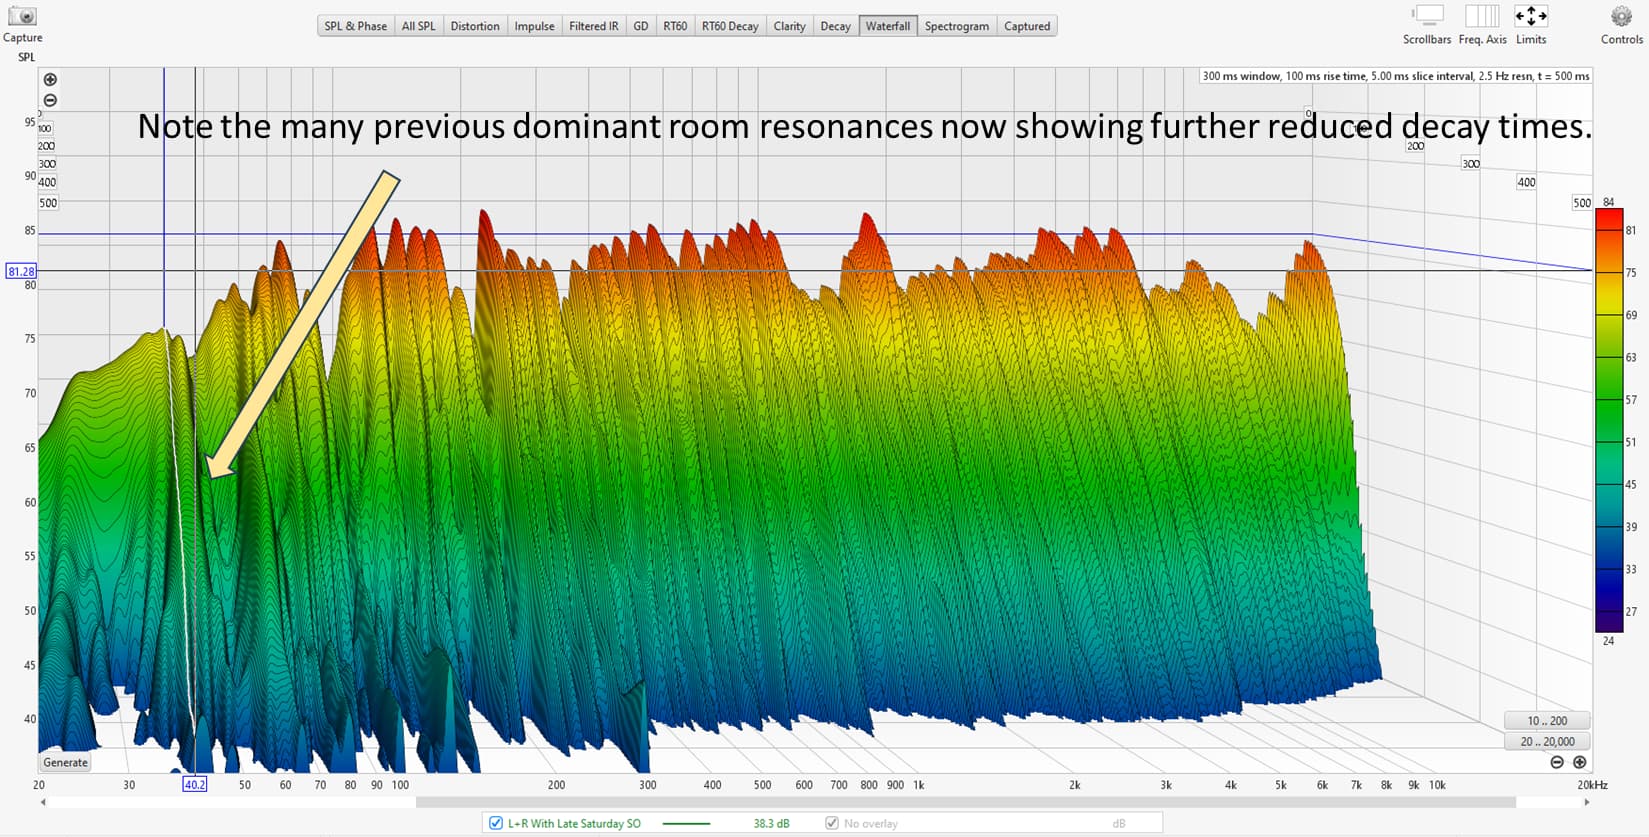
Results are presented as a Waterfall plot (see next posting no. 8).
Why? - These results are used to confirm Room Design accuracy and highlight the subsequent Optimisation trade-offs.

The stimulus for the acoustic measurements is a sinusoid log chirp sweep of greater than 45 second duration.
Why? – Slow sweeps are needed so that long decay room resonances have minimum impact on the measurements.
Also note the Environmental conditions (temperature and humidity) at measurement because these affect the Room Mode filter design.

2 Likes

This is the Sixth Posting and is an Example of a Reference Measured Frequency Response:

Separate measurements for each channel L (red trace) and R (green trace), single horizontal mic.

1 Like

This is the Seventh Posting and is an Example of a Reference Measured Spectrograph Response:

L+R, single horizontal mic, No Space Optimisation

1 Like

This is the Eight Posting and is an Example Reference Measured Waterfall Plot

L+R, single horizontal mic, No Space Optimisation

1 Like

This is the Ninth Posting (and where the main part of the work starts):

Creating a Good Space Optimisation – Enhanced Approach (2):

Combine Acoustic Modelling (Linn) with Acoustic Measurement (REW):

a) Read Background Information (see info on limitations of Computational Fluid Dynamics).
User action – optional (but probably helpful) study of highly technical information.

b) Create appropriate Room Design (selecting appropriate complexity) and corresponding Optimisation(s).
User action - required reading (62-page manual) and accurate measuring of room(s) required with tape (or laser) measure.

c) Evaluate Room Design (including Absorptions) by inspecting candidate Optimisation Filter Design.
User action - interpretation required of technical information and potentially several cycles of data input adjustment.

d) Evaluate Room Design by using Acoustic Measurement System.
User action – follow the on-screen guidance and undertake microphone measurements at listening position.

Hi @tt33 (and perhaps also @Orac who expressed intrest in this information at end of Februaury), or anybody else who is following and is interested, perhaps if you could respond now (before I continue) and add a few questions or comments so that I dont hit the continuing posting limit on the forum?

Thanks.

E of E

pls continue!

1 Like

Hi @Edmund-of-Essex
Yes I’m still interested.
For me what I am looking for is more in the way of “dummies guide to setting up sound optimisation with Linn SO”. Conscious this is a Naim forum so understand if there is a need to keep it brand agnostic. Would also appreciate inclusion of a beginners guide to SO in general so I can get basic understanding.
As a beginner to the finer details being discussed here I am looking to gain the ability to understand and adjust my own system so it performs as best it can in my environment playing music I like. I sense I am also going to need a decent mic and also a couple of programs to record sound levels - recommendations appreciated although I have seen some mentioned above.
Would probably benefit most from a visit by your good self but that will probably not be possible due to geography. :joy: :joy:

Kind regards

2 Likes

Hi @Orac , thanks for joining with clarification of what you are looking for. There is quite a lot of information distributed through this thread already on how I go about things for my own situation - but the approach described will not suit everybody (or even anybody).

Regarding the point made in your second paragraph, all I can suggest is that it is a personal journey (to find your way) to adjust your own system so it performs as best it can in your environment. Many on the forum have very many years of trying things and experimenting (and buying stuff). A few (maybe more than a few?) are quite analytical (e.g. me) and what is described on this thread perhaps is best suited to those who revel in this approach.

I do not wish to claim expertise greater than any other forum participant - I am simply sharing what I have learnt in the last 12 months using Room Equalisation Wizard (combined with LInn SO).

I encourage you to do what I have done, read widely available (sound, scientific) information, spend time studying and try some experiments yourself (if possible) in your home environement.

If you wanted to start with a simple online resource - also use the GIK Acoustics website - even if you have no intention of buying or using acoustic treatement. I found that website one of the most trustworthy information sources. But for Linn SO, there is no quick substitute to reading the 62 page Linn Docs Linn Space Optimisation manual AND following and applying the advice in the manual!

Regards, E of E

2 Likes

This is the Tenth Posting and here begins the extra special stuff:

Create Space Optimisation Room Designs (Simple* and Complex**?)

The reason to create two (or more) room designs is that Computational Fluid Dynamic modelling (e.g. such as used by Linn SO) can create errors that cause the ‘model’ (cf Linn SO the Room Design) to differ from reality. These errors may affect the centre frequncy of the resonances and/or the time decay of the resonances (in the modelling - not in reality).

Here are three examples of this ‘Simple’ and ‘Complex’ approach for Room Designs in Linn SO.

1 Like

This is the Eleventh Posting and we are going deeper now! Next Step is to:

Then…

Some examples of ‘Simple’ Room Design Evaluation (note the overlay of REW SPL graph in backround)…

and ‘Complex’ Room Design (again, note the overlay of REW SPL graph in backround)…

Final step of the evaluation of the Room Design(s)…

Please note the following:

  1. The main axial room modes (the lower frequency resonances) are the ones to check. Also, the floor to ceiling mode(s) are often problematic for Room Correction systems in general.

  2. If there are two (or more) resonances very close together (in frequency) in the room, the sound pressure level graph in REW may present an artificially narrow bandwidth, whereas the Space Optimisation software will try to predict the grouped resonances (e.g. as shown in the two filter design examples above - look closely at both charts, inc left and right channels, at what is going on around 58Hz).

1 Like

This is the Eleventh Posting and we are about to test and measure what we have created:

Evaluate Room Design by using Acoustic Measurement System!

Of course, at this point, you could ‘cop out’ and just use your ears to check if you are happy. But our team are high performing and we don’t want the result to depend on a (random) penalty shoot out, so here goes…

Here is the Example Frequency Response with Room Correction
L+R, single horizontal mic, Space Optimisation On (the two Barn Conversion room designs)
Note the use of the ‘All SPL’ tab in REW to display these results (Purple is Reference, Red is Simple Room Design, Green is Complex Room Design)

Example Reference Measured Spectrograph Response
L+R, single horizontal mic, No Space Optimisation

Example Spectrograph Response with Room Correction
L + R, single horizontal mic, Space Optimisation On – Simple Room Design (65% - 35%)

Example Spectrograph Response with Room Correction
L + R, single horizontal mic, Space Optimisation On - Complex Room Design (65% - 35%)

At this point we are nearly finished, but for the Waterfall plots and the final Ears based listening test I will continue on the next (Twelvth) posting.

1 Like

Hi @Edmund-of-Essex, I find this very interesting indeed - thanks for posting all that detail, and please do continue. At the moment I have insufficient free time to dwell deeply on any aspect, simply reading and partially digesting the information, but I intend to come back to it in due course.
Edit: typed after your ninth, but failed to post till later - see you have already added!

1 Like

This is the Twelvth and final posting (apart from the Appendix)

Following on from above, the measured Waterfall plots are…

Example Reference Measured Waterfall Plot
L+R, single horizontal mic, No Space Optimisation

Example Waterfall Plot with Room Correction
L + R, single horizontal mic, Space Optimisation On - Simple Room Design (65% - 35%)

Example Waterfall Plot with Room Correction
L + R, single horizontal mic, Space Optimisation On - Complex Room Design (65% - 35%)

But I hear all the shouting in the crowd… So What! … just use your Ears!

For those who want to ‘know’ which setting is scientifically correct? Just keep reading…

The final selection of Room – i.e. Simple vs Complex (and any associated Materials and Absorptions) is made when the SPL, Spectrograph and Waterfall plots indicate that the Room Mode Filters have the best match to the measured room resonances.

This is when the centre frequencies and bandwidths of the Room Mode Filters match the measured room resonances (ref. postings 6, 7 and 8) and correctly suppress and quench the resonances (comparisons shown in prevoius posting 11 and this one).

The summary graphic describing this is here (however the page numbers shown do not relate directly to these postings)…

Creating a Good Space Optimisation – Enhanced Approach (3)

Select Optimisation(s) for Critical Damping (i.e. so ‘Q’ is about right):
a) Create Optimisation(s) with more bias towards flatter frequency (e.g. 70%-30%).
b) Create Optimisation(s) with more bias towards shorter time decay (e.g. 40%-60%).
c) Acoustically Measure each Optimisation, paying particular attention to the following:
i. Even decay times of the resonances shown in the Spectrogram (and Waterfall plots) and comparable to whole audio band.
ii. Flat line of Peak Energy Time (see Spectrograph) over the bandwidth of SO (bottom 80Hz), with minimum sharp deviations.
iii. Smooth slope (no undulations) in the decaying ridges in Waterfall plot for the resonant frequencies.
iv. {Optional: Smooth slope (no undulations) in the RT60 Decay chart in REW for the low/resonant frequencies}.

Final Check (using your Ears):
Does the sound improve with the selected Optimisation?

1 Like

Summary: Very many thanks for following this precise and accurate method to create of a successful Space Optimisation for your Room.

To settle on your final Optimisation, select a choice of two or three to experience over a week or more.

An important activity is to confirm the ambient temperature (and humidity) is the same as selected for the Optimisation temperature (and humidity). Note that the distance travelled by sound waves is much greater in larger volumes and can lead to more error buildup in the Optimisation models.

If, after using this enhanced method and confirming the Environmental conditions, you consider the sound with Space Optimisation turned Off to be superior to that with Space Optimisation On, simple remedial action can be taken as follows:- Remove (or include in the Room Design) any acoustic polluting items that may be in the room (e.g. other unused loudspeakers or large TV screens). Then repeat the process steps again to super tune more thoroughly the Room Design. Nevertheless, this may not achieve demonstrable improvement (and in any case you may prefer a ‘warm’ or even ‘boomy’ sound because that is familiar).

Final note to our sponsors: Thanks to Focal/Naim for allowing this thread to exist. It is not intended to be competative or in any way detramental to Focal or Naim products. In fact, as a general method, the use of REW in the way described could be used to accurately programme the centre frequencies and bandwidths of the null filters of the new NAIM range of CI product. Perhaps such room acoustic correction features will emerge soon in higher end (seperates) range of products from NAIM?

Appendix: Modelling using Computational Fluid Dynamics (CFD)

Getting the Basics Right:
a) Pick an appropriate algorithm for the problem at hand (i.e. FEM, FDTD, BEM or dG-FEM) (1)
b) Choose an appropriate simulation sampling density for the problem at hand (2)
c) Avoid unnecessary details in geometry data that can negatively impact model accuracy (3)
d) Have sufficient fidelity and accuracy (ideally validated) in the boundary modelling (4)

  1. Linn Products selected Finite Difference Time Domain (FDTD) as the modelling algorithm for Space Optimisation.
  2. Linn Products selected 10cm as the spatial discretisation for Space Optimisation and a geometric dimension accuracy of +/- 5mm.
  3. Linn Docs includes several paragraphs and clarifications on what NOT to enter in the room data for Space Optimisation.
  4. Linn Products includes various material options (and adjustments) for the boundaries available to be applied in Space Optimisation.
1 Like

@Edmund-of-Essex thanks a million for this series! I need to find some time to digest this. Be prepared for questions. :slight_smile:

1 Like

For information, in the UK workplace 80 dB(A) is the First Action Level, where hearing protection should be provided. 85 dB(A) is the Second Action Level, where hearing protection is required to be worn

DG…

1 Like

IIRC (t is a few years since I ceased to have direct professional involvement) the limits effectively say that there are no hearing concerns if the average sound level is below 80dB(A), regardless how long exposure, and that the risk of exposure to 85dB(A) average for 8 hours per day is acceptable, but for average sound levels above 85dB(A) exposure hearing protection must be used, or exposure time limited, halving time for every 3dB above 85, so 4 hours per day @88dB(A) average, 2 hours @91dB etc.

It is interesting to extrapolate this to domestic exposure: provided noise at work for those working does not exceed an average of 80dB(A), then it is likely that up to 8 hours music playing (or other noisy activities) at an average of 85dB(A) - which allows for quite realistic levels of music other than rock - is unlikely to pose any adverse effect on hearing. Playing louder should be time limited, halving time for every 3dB above. This consideration accommodates rock music at or near realistic levels for an album or two a day if desired, and is the consideration I make. There is also a maximum peak sound level in the H&S regulations, 130 or 135dB IIRC, but is academic for music listening as very few domestic systems would be able to achieve that, with the possible exception of headphone listening?).

3 Likes

Because of the recent Twelve or so postings (by me) and also the engagement and responses from other members. I thought I would amend the thread title and ‘invite’ those forum members who are interested to have a go with a measurement microphone and the (‘free’) Room Equalisation Wizard (REW) software in their own listening spaces?

Feel free to post here with your experiences (or not at all) - whatever you want.

1 Like