Oh no, SCOTLAND have Scored!
And AGAIN, Scotland are now two ahead and the final whistle is due!
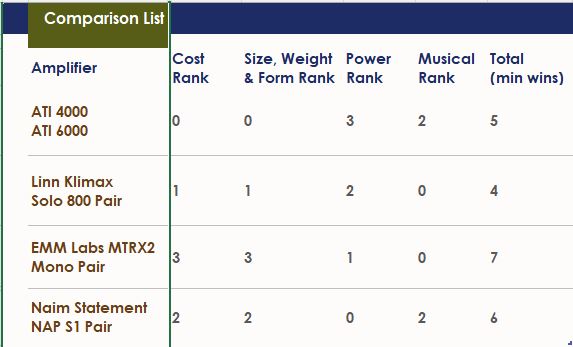
(Remember that the Lowest total in the leader board wins.)
Oh no, SCOTLAND have Scored!
And AGAIN, Scotland are now two ahead and the final whistle is due!
(Remember that the Lowest total in the leader board wins.)
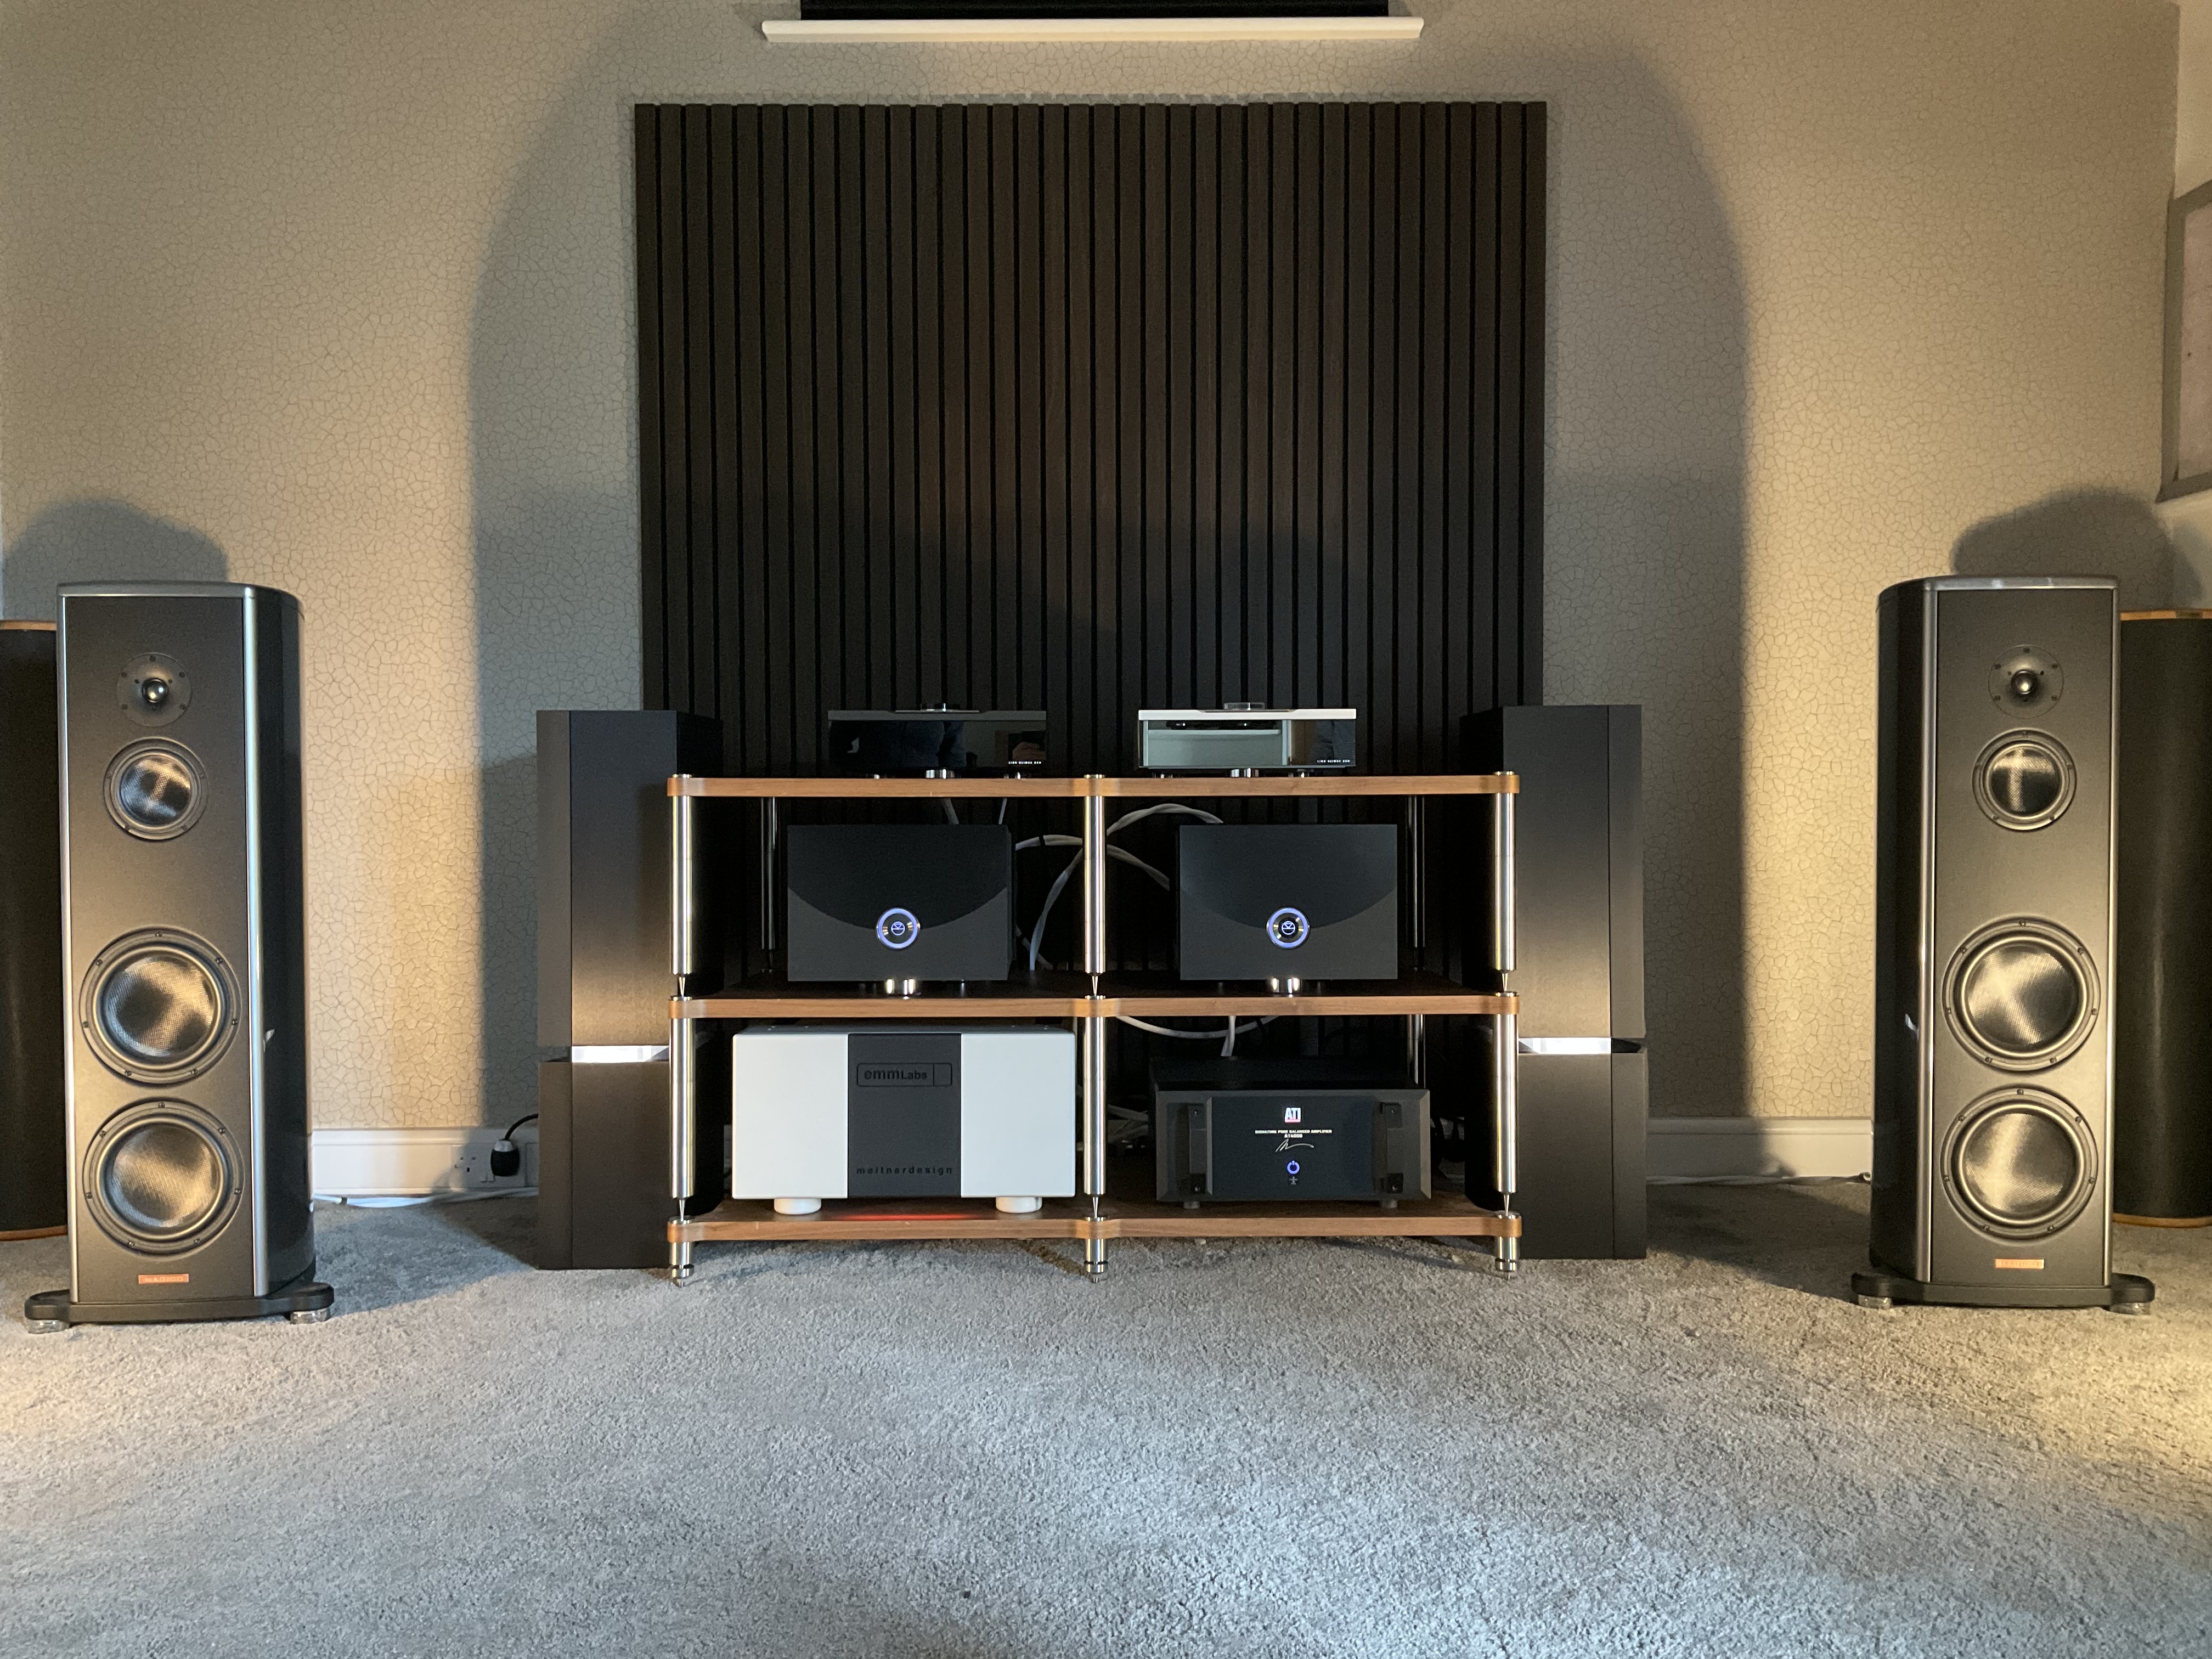
Your room is upside down… ![]()
ENGLAND have scored, with just 3 minutes and 11 seconds remaining!
Is 3.11 significant in any way to do with Amplifiers?
Oh no wait, it is the wrong tournament, that goal by ENGLAND was for the Streamer tournament.
Amplifier tournament still has SCOTLAND ahead by 2.![]()
May I ask, what pre-amp are you running with the NAP S1’s? Are you using a Linn ‘pre-amp’ output in to the various amps?
If memory serves, some reviewers have used Statement pre and amps in differing set-ups and concluded they are much better together, with the thinking that the primary gain comes from the Statement Pre.
I am still waiting for delivery of the amplifiers.
The preamp of the Statement was not used for the main tournament that I attended. However the dealer did evaluate the whole configuration in the qualifiers (day before the main tournament) and concluded that the Linn pre and Linn power was superior (to their ears) to the Naim pre and Naim power.
Obviously they did not tell me their view of this ahead of the main tournament!
Well, to stay with your football analogy, you’re going to need plenty of extra-time, as Statement amp’s take months to warm-up (>3M) and not using Statement as a set is highly sub-optimal. If you haven’t already, search the web for Audiobeat’s review of (full) Statement. At this level, I suspect it’s a matter of presentation which will guide a person in one direction or another.
Actually, I gave the ENGLAND team an (unfair?) advantage. I asked the dealer to let ENGLAND warm up for at least a whole day if not more, whereas for SCOTLAND I said just get them off the bus and onto the pitch straight away.
And you know what, that active FPGA controlled bias of SCOTLAND outperformed the thermal tracking bias (?) of ENGLAND for the whole session.
PS: From a return on investment point of view, I do not tolerate three months of underperformance. Let alone the six months (since the last software update) that the ENGLAND streamer team seem to be delivering ![]() .
.
PPS: I still own an ENGLAND classic CD player.
Hi All,
Final whistle is blown.
Well, what a surprise, SCOTLAND have won a major international tournament for the first time in their footballing history!
Delivery of trophy amplifiers is this coming Tuesday.
I might post pictures afterwards.
Congratulations Edmund, I hope the celebrations continue for as long as they will in Newcastle in light of our recent success. Hope the Scot’s stay in form!
Is that a M series pair you now have up front? World class replacements for the S series indeed (my current lineup).
Hi @Protegimus, apologies for my delayed response.
Yes, I have M2. But I did not hear them before buying! I was trying to settle on what colour to order for S3s (having undertaken extensive listening trials at dealer and at home between S1 and S3) and whilst I was trying to decide on the colour of S3 - Magico launched the M2, so I figured they must be better? Also they were slightly less dominant visually in the room.
In case anybody is still interested, here is a pic of the ‘trophy room’ before the football/HiFi tournament matches started……..
You might see a certain expectation bias expressed for the ENGLAND (HiFi) team to win.
I mean that NEVER happens for the ENGLAND football team in an International competition does it?
Hi @mikehughescq, many thanks for your posting. I know it has taken me nearly two whole months to reply, but given what I thought I might post next I didn’t think an immediate reply would help.
Even now, when I read your reply…….
I can see it was meant (and taken) completely honestly and genuinely.
However, the wicked part of me also can read it in complete irony. Indeed what an overinflated sense of achievement Naim have had and the subsequent way of treating some customers (re: unhappy with Naim update thread) since the new management have taken over?
So this bizarre thread is about to end?
Do you now have your amps? Photos welcome to relieve the agony!
Hi, I apologise to any viewers who may be in agony ![]() .
.
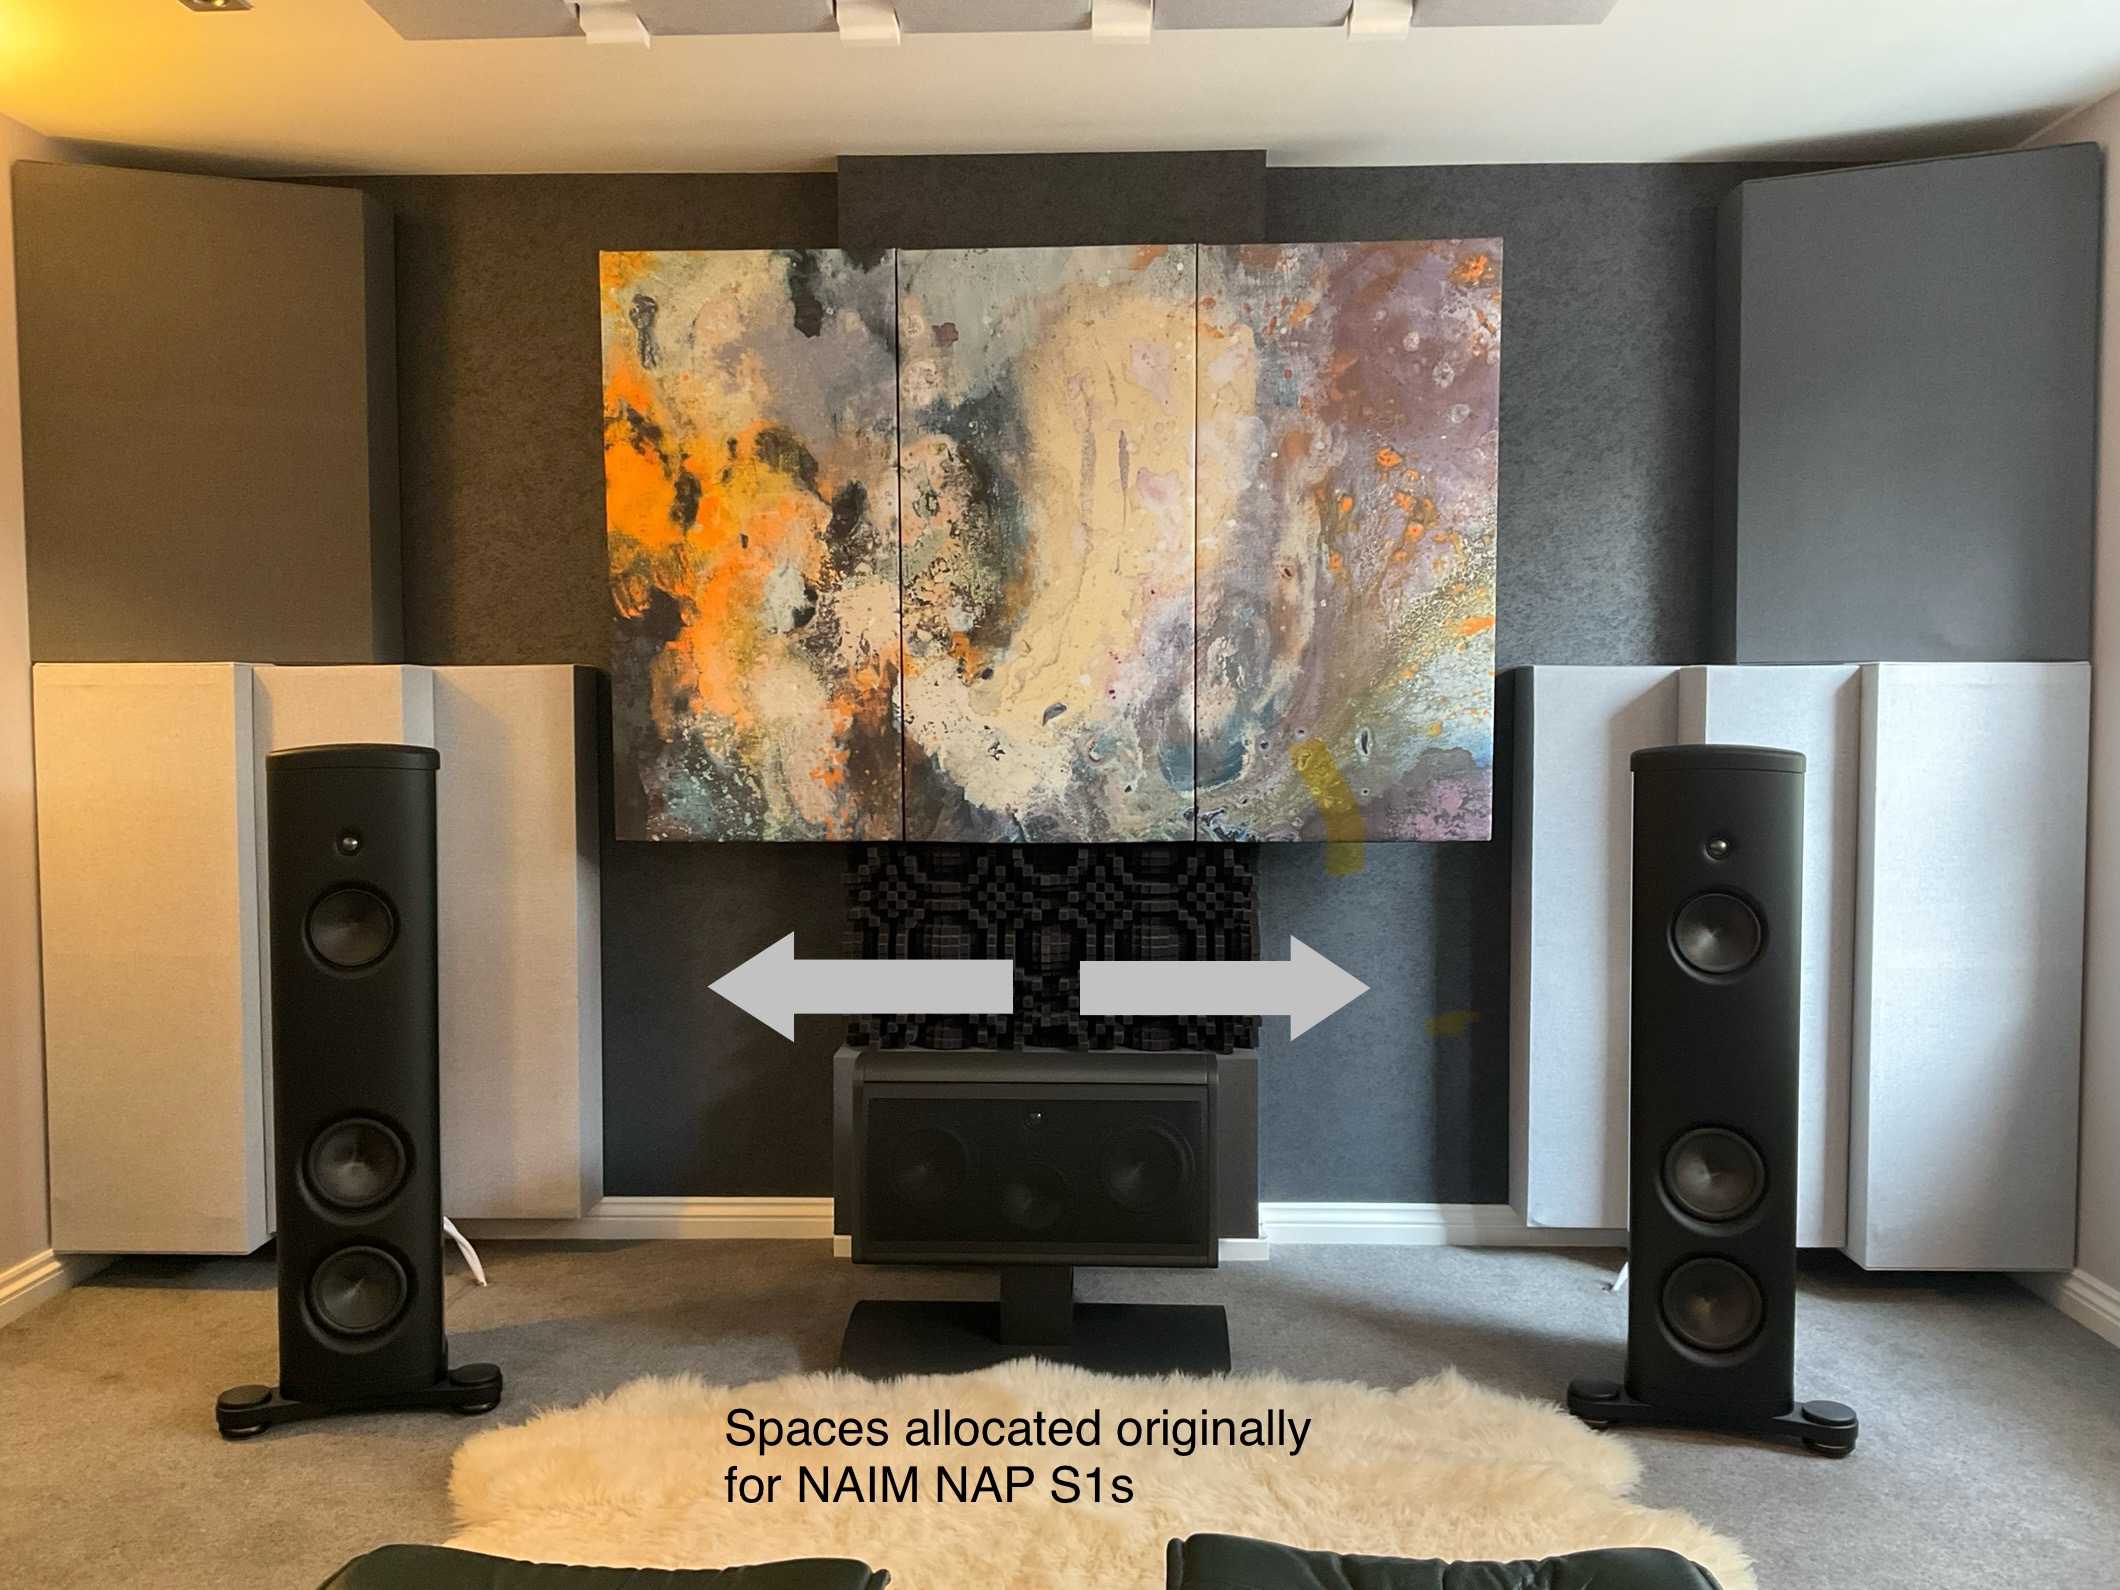
I do now have the amps ![]() and they are in the system (electrically) but not the intended final position in room. So I would rather not post the ‘how it looks from the listening position’ picture just yet. ( Not long to wait now though).
and they are in the system (electrically) but not the intended final position in room. So I would rather not post the ‘how it looks from the listening position’ picture just yet. ( Not long to wait now though).
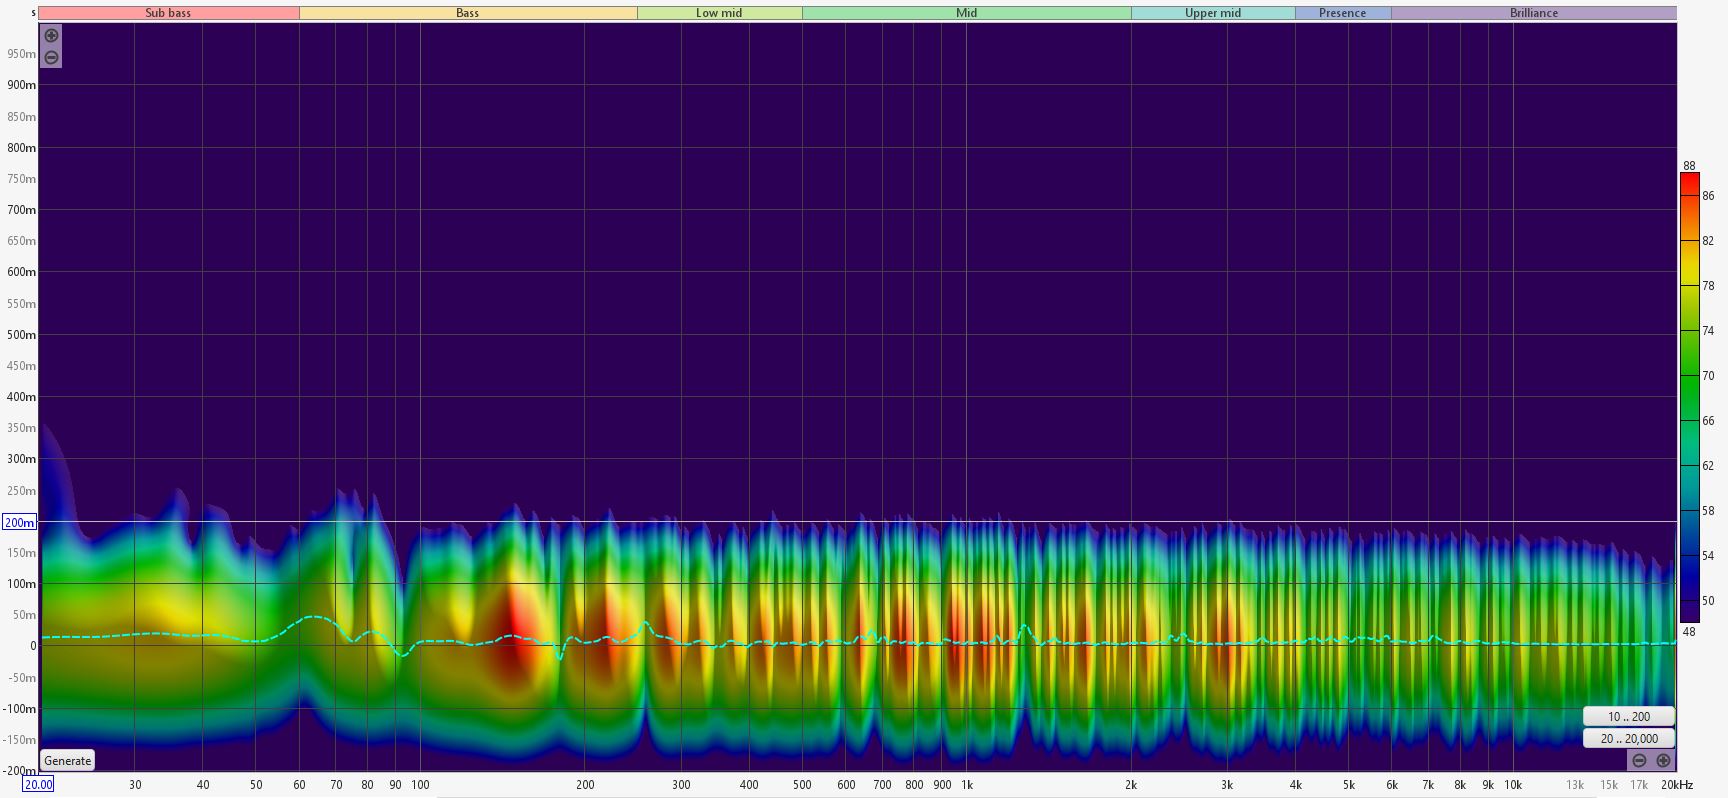
In the meantime, as @AndrewG is science trained, I thought this picture (obtained using the new amplifiers) may be of interest.
PS: There may be more of these kinds of pics if people express an interest.
Thanks for your reply. I look forward to seeing your system pictures.
I am, indeed, a scientist and am used to looking at data and representations of it. So, as an ignoramus when it comes to technical audio matters, please explain (concisely) what is shown in your colourful chart and what it means.
I have been listening to HiFi and reading HiFi publications for almost 60 years but have seldom, if ever, looked at the technical specs, lab test results, etc. What I care most about is what the equipment sounds like. After that I would consider functionality, aesthetics, reliability and, of course, price.
Clearly your approach is very different to mine, but there’s nothing wrong with that!
I think we all care about what things sound like - me too. However I am going out on a limb here to suggest that, with training, one does not need to hear a system to know what it sounds like🙊.
The image I posted is a Spectrogram which is an image that tries to convey room resonance, or reverberation.
The spectrogram is obtained by measuring the sound in my room at the listening position using a cheapish calibrated microphone and analysed using software that is available to be downloaded onto a computer. The software in question is Room Equalisation Wizard (REW).
The measurement stimulus from REW in this case is a slow (45 second) sinusoidal chirp sweep from 20Hz to 20 kHz, covering the audio bandwidth.
The graph represents the three dimensions of measurement.
Horizontal (X axis) represents frequency presented on a logarithmic scale.
Vertical (Y axis) represents time on a linear scale from initial sound out to 1 second reverberation at the top of the chart (the units on the graph are milliseconds).
The third dimension, coming out of the page (Z axis), represents the magnitude ie loudness of the sound. The coloured bar chart (on the right) gives the scale for the magnitude in sound pressure level. Red is ‘hot’ ie loud. Blue is ‘cold’ ie quiet.
This graph shows that the room is very very balanced but on the dry side with a very low reverberation time across all frequencies of 200 ms.
I will need to post more images to give the complete picture of how the room sounds. but I hope this answered your initial question.
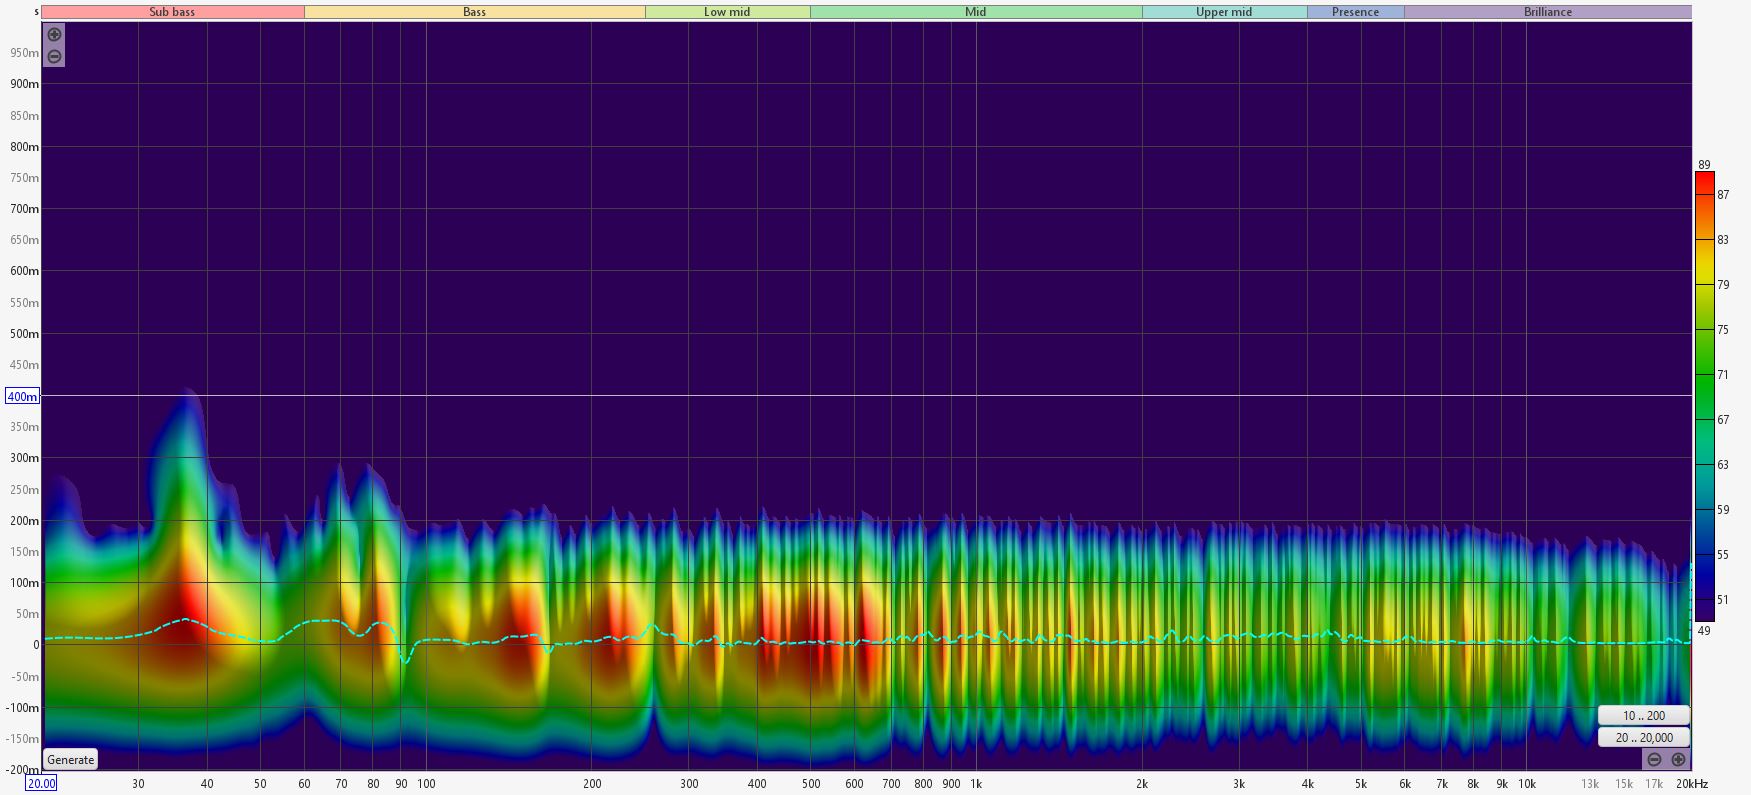
Hi @AndrewG, I thought it might help if I posted a few examples of Spectrograms, including one of my room last year.
The focus of the assessment is to make sure that any resonances do not extend out in time unequally compared to adjacent frequency bands (which are identified in the top part of the graph with terms like sub bass and bass etc).
First, here is my room last year before I added the final touches…….
Hopefully you can see that there is extended resonance in the sub bass and a little bit in the bass region.
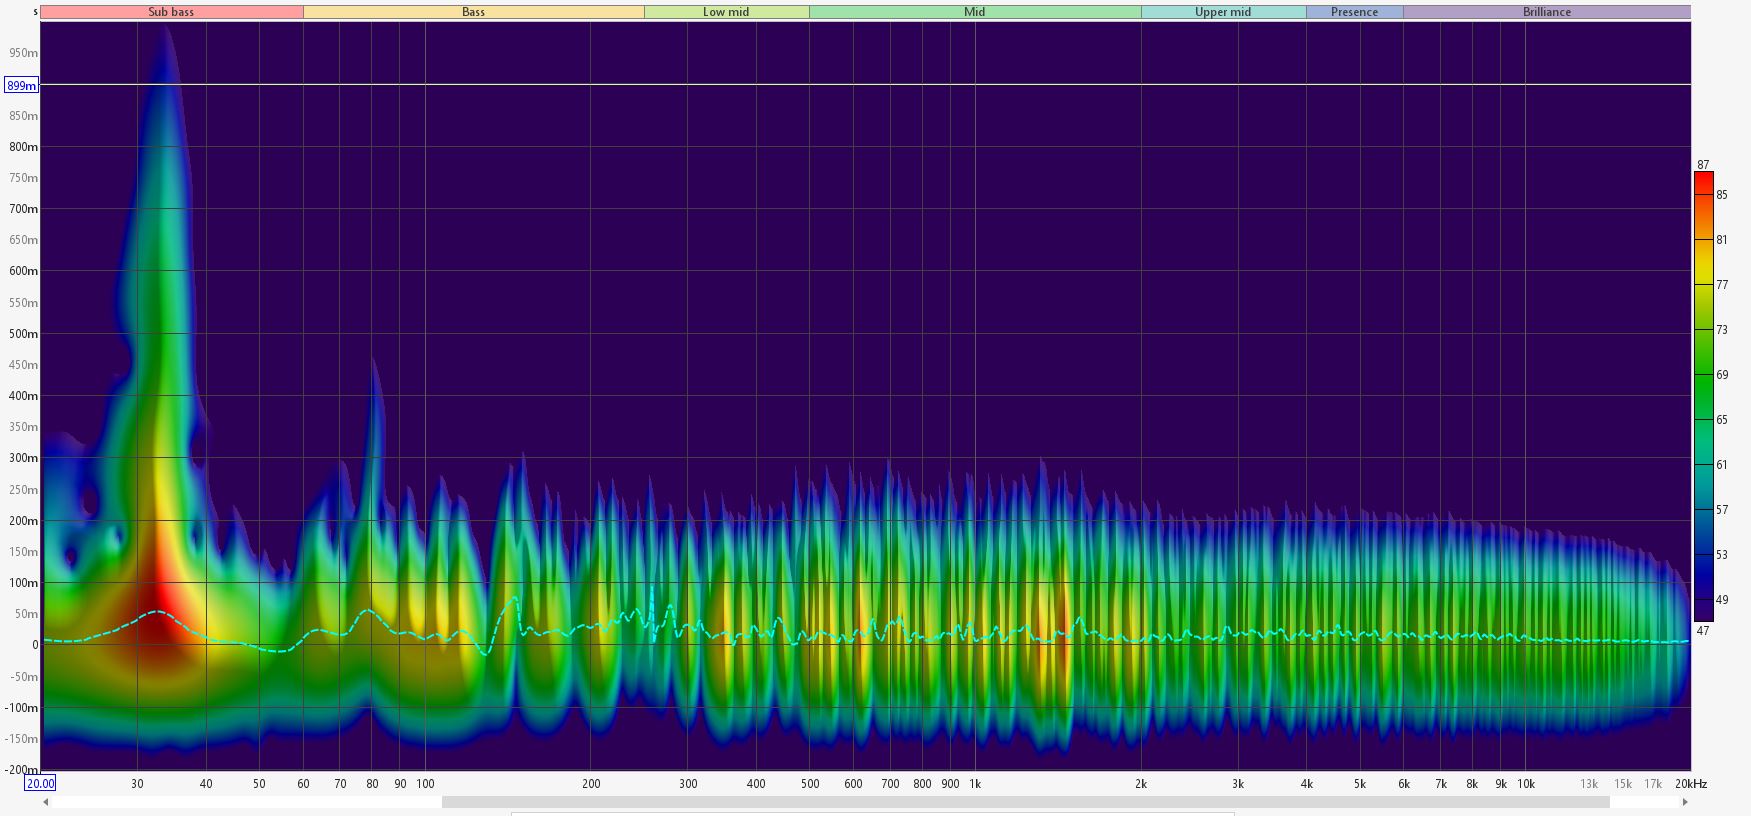
Next, here is an example of an (untreated) typical UK living room…..
Hopefully you can see the very extended and problematic sub bass resonance, which will prevent the listener from fully hearing the details in the music.
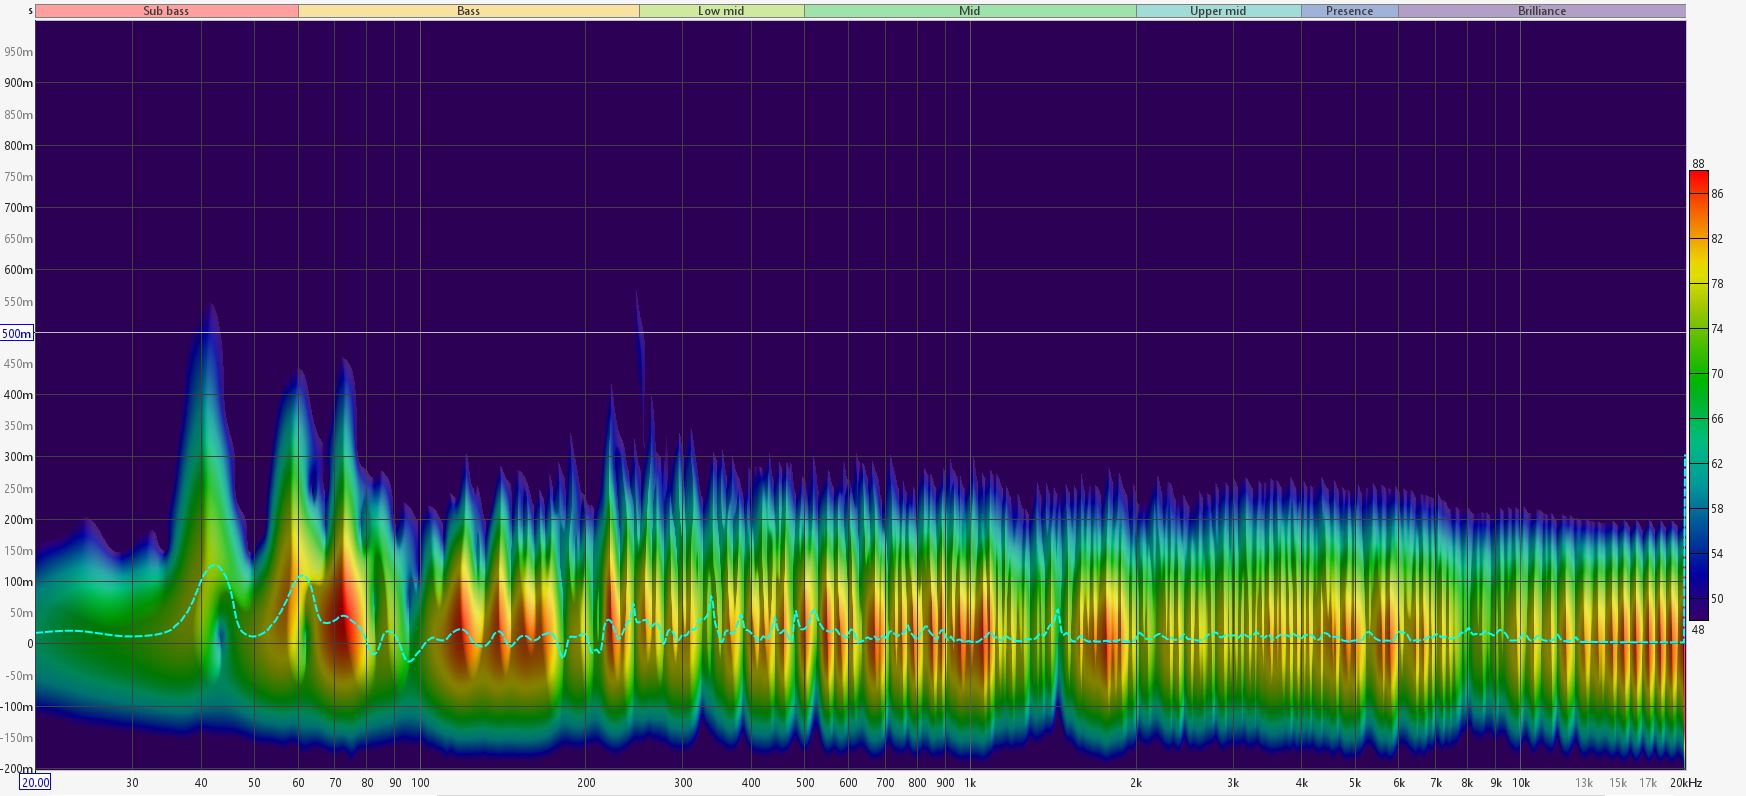
Now, with a larger room volume, sub bass and bass resonance is less of an issue, and with some limited treatment this is what you might see……
Hopefully the above gives you some idea of the art of the possible by inspecting spectrograms.
Many thanks for the interesting explanation. You are effectively saying that, armed with data of this type, you can predict what an amp will sound like. And you don’t need to do listening tests before you buy?
If the data is available and accurate and the test conditions are understood, then YES, one can predict what a system will sound like.
Of course there is quite a risk in undertaking component selection in this way, and really the listeners ears are the final judge.
However, I might just add that I bought my ATI4005 (American import) amplifier without a prior listening trial. I bought all of my Magico loudspeakers (non of which I had explicitly heard prior to purchase) based only on listening to Magico S1 and S3 models.
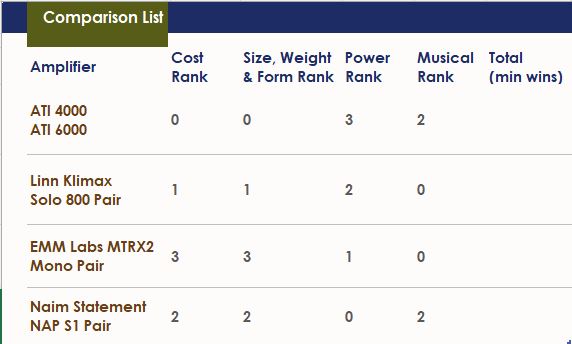
Prior to this final international amplifier selection, I had considered just purchasing the Sanders Magtech Mono (Pair), which is available only on direct sale from the USA. If you look at the chart right at the start of the thread, you might notice that it has superior linearity (THD + N) to my ATI, but with a slightly inferior signal to noise ratio. What makes the Sanders amplifier notable is it’s MASSIVE (estimated) peak current delivery, for which I am sure @Innocent_Bystander will approve !
PS: The amplifier comparison chart at the start of the thread is not showing all the line entries, Soulution had an additional line in there also.
PPS: I see you also read HiFi publications. The one I use quite frequently is Stereophile Magazine.